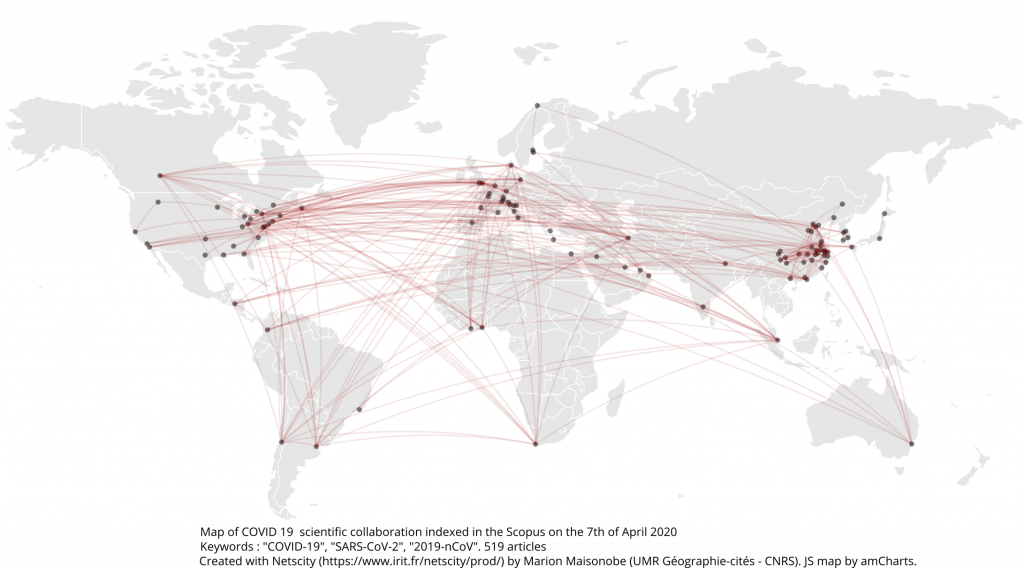
Since the end of 2019, research on COVID-19 has been carried out at high speed and generates international cooperation in the form of co-authorship of scientific articles. China, the hotbed of the epidemic, is the main producer of research on the new coronavirus, but more than 100 countries are involved as of 18 May 2020. This note reviews the geography of research on COVID-19 and its evolution between 23 March and 18 May 2020.
Foreword on Scientific Production
The rapid spread of COVID-19 and the need to find solutions to curb the epidemic and deal with its consequences explain why we are witnessing an accelerated mobilization of scientists to publish their results. These publications take the traditional form of articles in peer-reviewed journals and the more direct form (as they do not pass through the filter of peer-review) of preprints on open archives (in particular bioRxiv, medRxiv and ChemRxiv).
From the point of view of the dissemination of knowledge, the academic biomedical publishing sector, dominated by private corporations with impressive sales margins (see the revenues of Elsevier or Springer), hastened to provide open access to academic literature on the subject of coronavirus (example at Elsevier: https://www.elsevier.com/connect/coronavirus-initiatives). Exceptionally, the knowledge produced by researchers from all over the world is presented as a public good and its open access as indispensable for a global and accelerated circulation of knowledge.
Wishing that these initiatives do not remain exceptional and confined to the case of the crisis we are going through, Vincent Larivière, Fei Shu and Cassidy R. Sugimoto call for an opening “without delay” of academic literature (Larivière, Shu & Sugimoto, February 2020).
Of course, this race for a vaccine and publications is not without suspicion of fraud and scientific error, as evidenced by the cases of retracted articles and preprints (see the Retraction Watch tracking site) and its share of scientific controversy. The Raoult case in the field of virology has received sufficient media (and political) coverage to bear witness to this (Science at the time of the Coronavirus, Gingras, 2020). Whether relying on the literature published in peer-reviewed journals or on publications available in open archives, one should therefore take a cautious look at the currently available data on COVID-19 related research.
Precautions taken, the note proposed here provides an overview of the evolution of the geographical origin of scientific publications related to the disease, published since December 2019. The note is followed by a review of similar initiatives, available corpora and tools to facilitate follow-up on the subject. Indeed, a concern is developing: how to monitor the state of the literature in the face of the deluge of publications and pre-publications? In an editorial published in the journal Science on 13 May, Jeffrey Brainard echoes this concern and draws attention to the tools that can help monitor the evolution of research dynamics in a context of “growth of science” (Brainard, 2020).
Tracking progress on Covid-19 research
Among the available tools, the web application NETSCITY, set up for researchers, scientific information specialists and scientific journalists to process data from major bibliographic databases, provides an interesting and quick overview of the origin of the first publications on Covid-19.
This application, currently under development, is already available in beta version at: https://www.irit.fr/netscity. It is the result of an interdisciplinary collaboration between three CNRS laboratories: UMR Géographie-cités (Paris), UMR LISST and UMR IRIT (Toulouse) with the support of the NETSCIENCE group of the SMS LABEX.
In the context of the crisis we are going through, this application can help answer the following questions:
- Where do the scientific articles indexed with “COVID-19”, “2019-nCoV” or “SARS-CoV-2” come from, since December 2019?
- Does this geography reflect the geography of the epidemic or are there specificities characteristic of the traditional geography of the field of virology, with a special effort of the areas where the historical laboratories of this field are located?
- What can be said about scientific cooperation in the form of co-authorship of publications? Despite the epidemic and the closing of borders, are we seeing the emergence of connections between researchers located in different cities, countries and continents?
A first analysis, carried out using Web of Science data on four dates in 2020, March 23rd, April 6th, April 20th, May 4th, and May 18th highlights the pre-eminence of publications from China and the progressive growth of publications from other areas, including the sub-Saharan area.
For the date of 18 May, an additional analysis is carried out using data extracted from the Dimensions database. The latter allows preprints to be taken into account. It notably includes preprints deposited on arXiv, SSRN Electronic Journal, BioRxiv, ChemRxiv, MedRxiv, PeerJ Preprints and Nature Precedings.
Here are the details of the data collected, followed by some graphical representations extracted from NETSCITY.
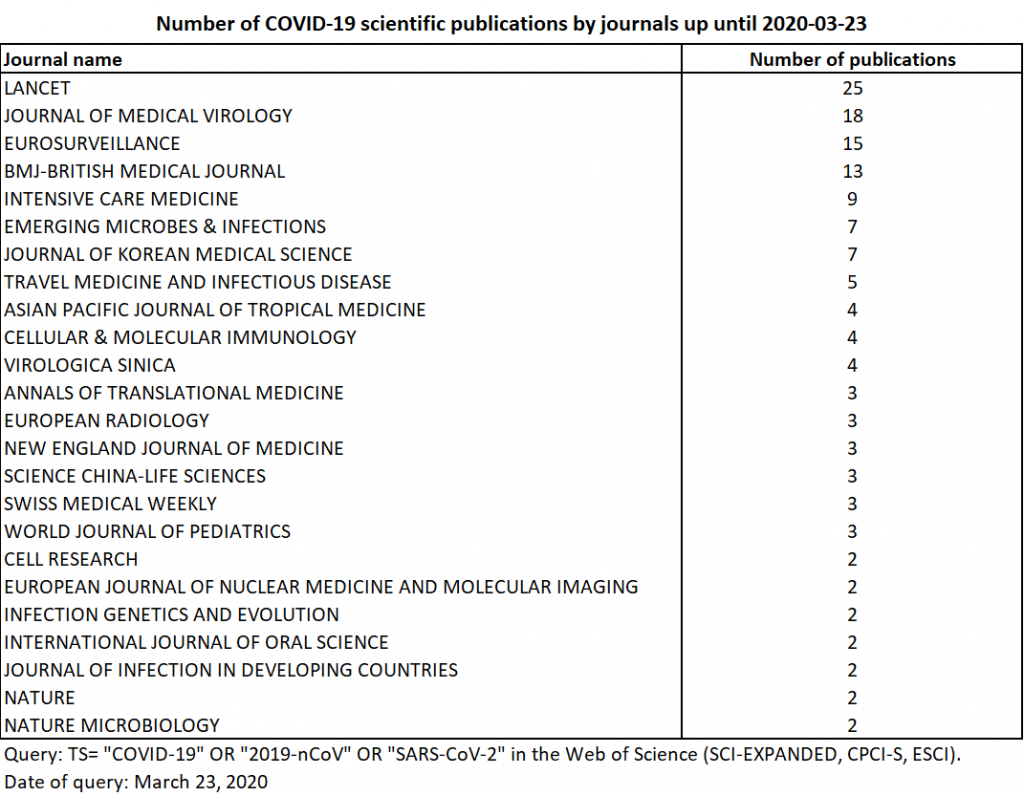
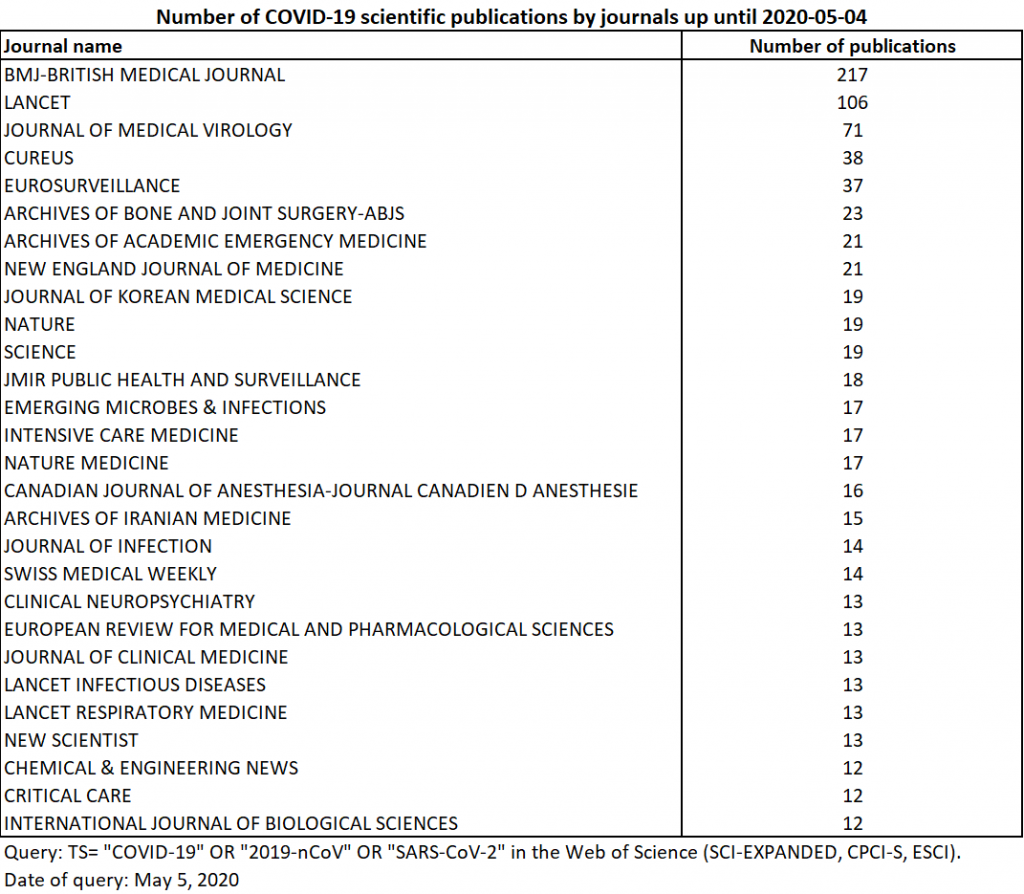
On March 23rd 2020, 197 publications were available in the WoS (SCI-EXPANDED, CPCI-S, ESCI), including 70 peer-reviewed articles, 65 editorials, 35 letters, 17 reviews, 9 news, and 1 correction. By way of comparison, for similar requests, Alexei Lutay found the following day: 386 publications in Scopus, 1262 in Semantic Scholar and 1766 in Dimensions. Given the coverage (the number of journals covered by the Wos remains more limited, these differences do not seem surprising) (Lutay, March 2020). From a thematic point of view, the main fields covered by these publications are general medicine, virology, infectious disease, immunology, microbiology, medical imaging and tropical medicine. The medical journal Lancet shows the highest number of publications to date (Table 1). Let us recall here that many weeks/months can elapse between paper acceptance, paper inclusion in an issue of a journal, and journal TOC indexing.
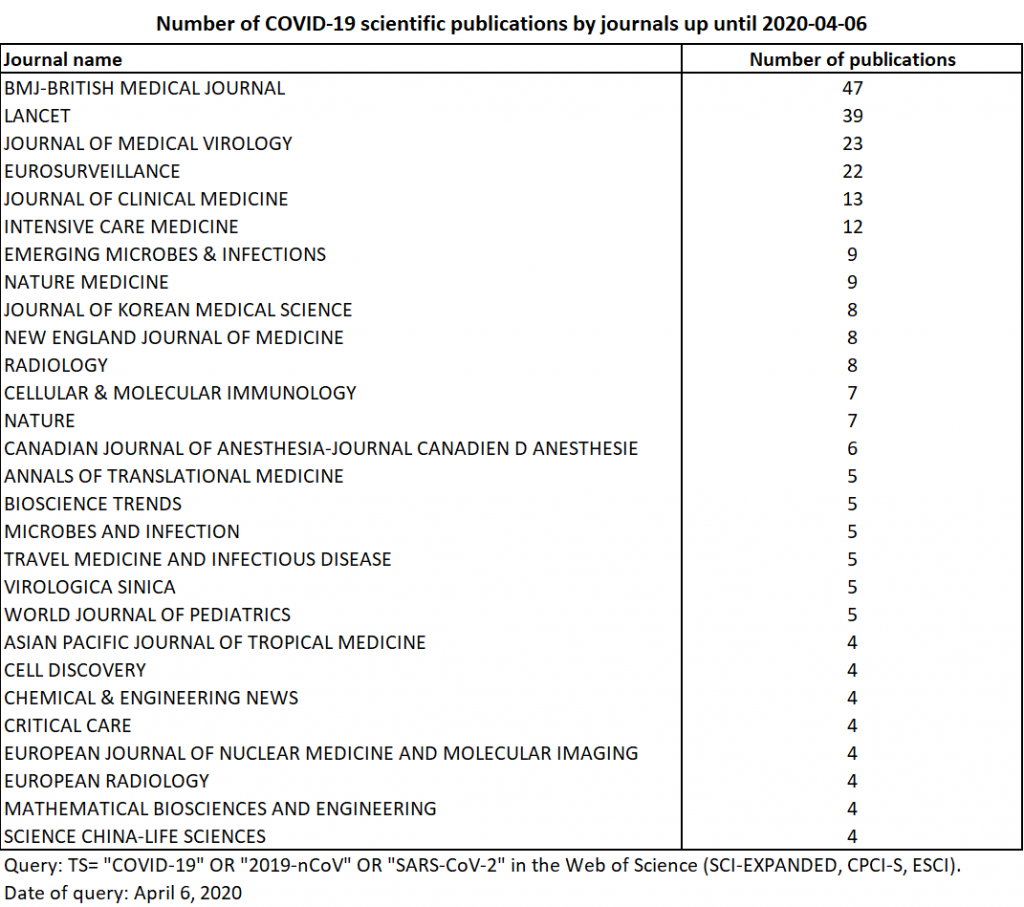
On April 6, 2020, the same query in the Web of Science returned 442 publications (twice as many as 15 days earlier). These included 146 articles, 137 editorials, 79 letters, 41 news, 34 reviews, and 5 corrections. The fields of pediatrics, biology and intensive care are more prominent. The field of tropical medicine is becoming more marginal. The main contributions remain in general medicine, infectious diseases and virology. At this time, the British Medical Journal (BMJ) surpassed Lancet in number of publications. The first three Web of Science journals publishing on the subject remain the BMJ, Lancet and Journal of Medical Virology (Table 2).
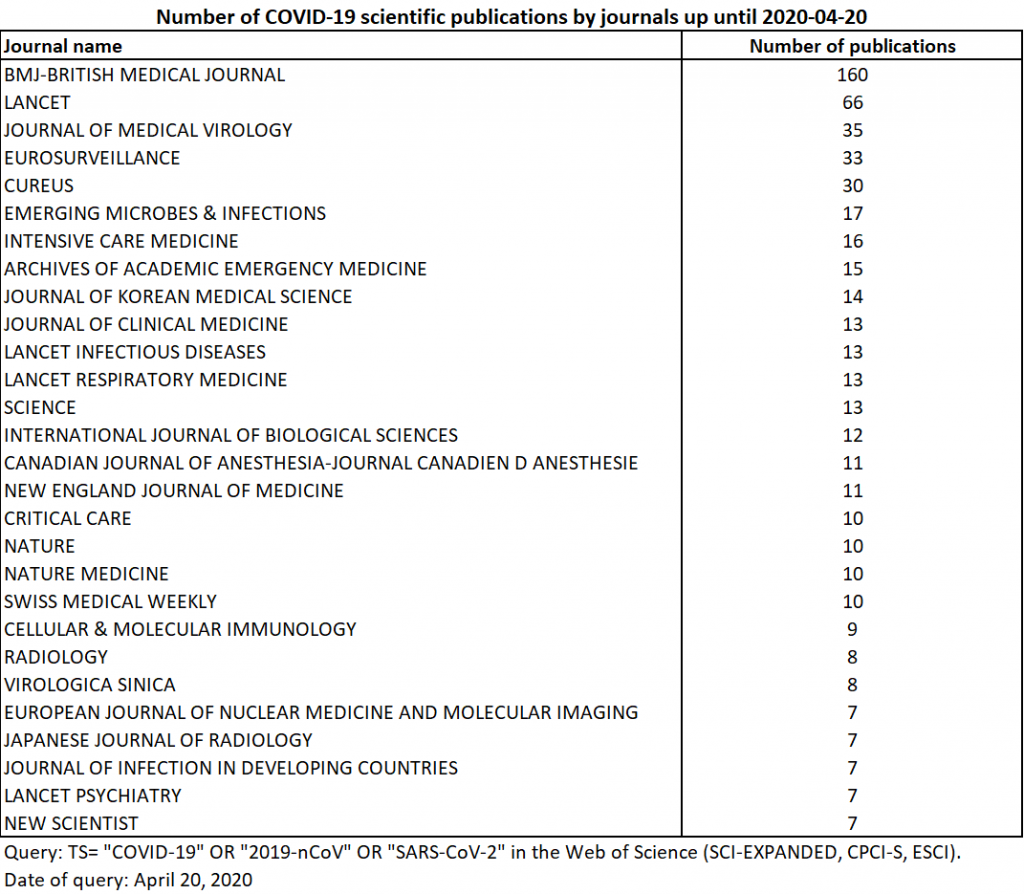
On April 20, 2020, there is 1095 publications (2.5 times more than 15 days earlier). These include 346 editorials, 334 articles, 180 news briefs, 127 letters, 92 reviews, and 16 corrections. Contributions in the field of public and environmental health, as well as in anesthesiology, immunology and oncology have increased. Following the same four first journals, we note the journal Cureus, which had only 3 publications at the previous date. Created in 2009, it has the originality of being open access and of practicing the principle of crowdsourcing in its evaluation process. This means that evaluation is open and the evaluators’ remarks are public. It is interesting to see this innovative journal, from the point of view of scientific publishing, at the forefront in this context of urgency (Table 3). This confirms, with the simultaneous development of open archive repositories, the attraction of new methods of knowledge dissemination and production.
As of May 4, 2020, 1913 publications containing the searched words in their metadata are indexed in the WoS. The growth was slightly less marked than in the previous fortnight (multiplied by 1.7 as opposed to 2.5 the previous time). Compared with competing databases (already nearly 5,000 publications for Scopus; 8,000 for Pubmed; more than 10,000 for Dimensions and Lens according to Jeroen Bosman), this rate may seem surprising, but it is consistent with the generally less exhaustive coverage of the WoS and may also be explained by the choice to index the information more fully (as of May the 4th, the proportion of addresses filled in per publication is 83%).
Among the 1913 publications, there are 629 articles, 592 journal editorials, 332 letters, 176 news briefs, 166 reviews and 18 corrections. In addition to the previous specialities represented, with general medicine, virology, infectious diseases, public health and radiology at the top of the list, there is an increasing participation of anaesthesiologists and dermatologists. The journals with more than 10 publications as of April the 20th remain in the top 30, and the innovative journal Cureus reinforces its place in the top 5 of the journals involved (Table 4). Two Iranian journals enter the top 30: the journal of orthopaedic surgery Archives of Bone and Joint Surgery and Archives of Iranian Medicine.
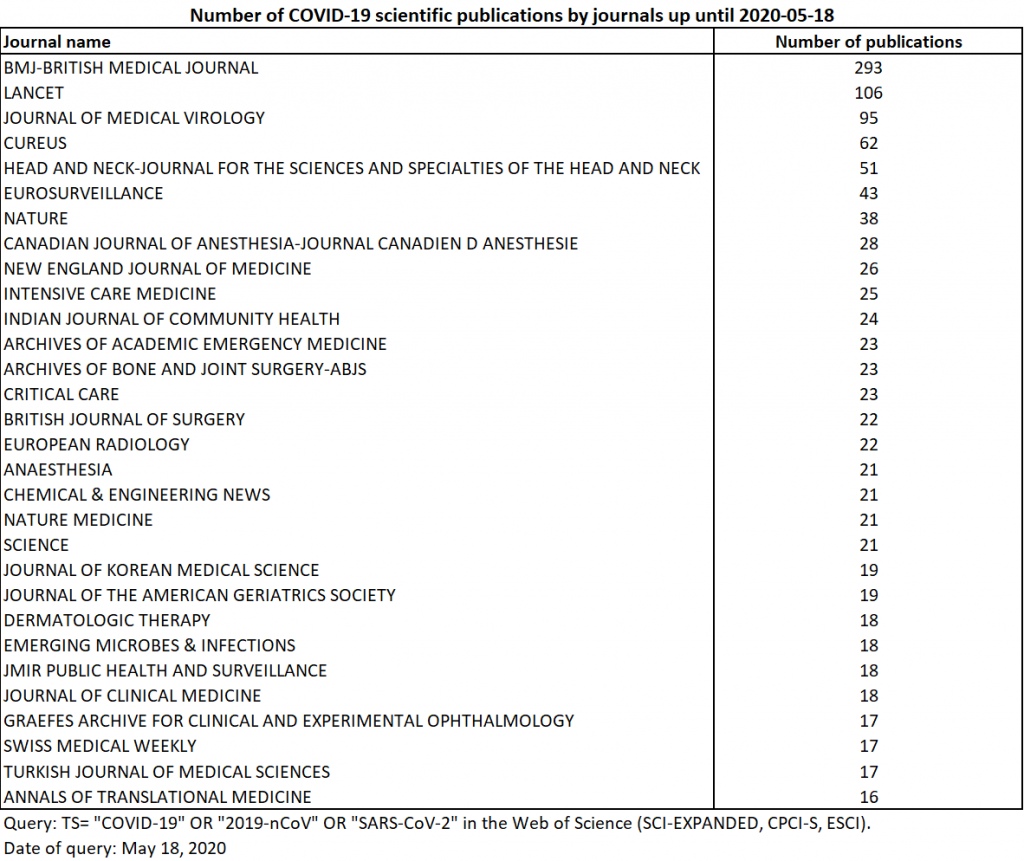
On May 18, 2020, the number of publications indexed on the WoS increased to 3398, or about 1500 additional publications in 15 days. These 3398 publications include 1120 articles, 1037 editorials, 658 letters, 297 reviews, 253 information notes, 24 corrections, 2 conference proceedings and 1 obituary. In terms of specialties, publications in radiology and medical imaging, as well as those in public health, have grown faster than publications in virology. The increase in publications in anaesthesiology and dermatology continues, but is accompanied by an even more rapid increase in publications in surgery, cardiology and otolaryngology. Otolaryngology is particularly well represented by publications in Head and Neck (Table 5). With 19 more publications than on May 4, the journal Nature ranks 7th.
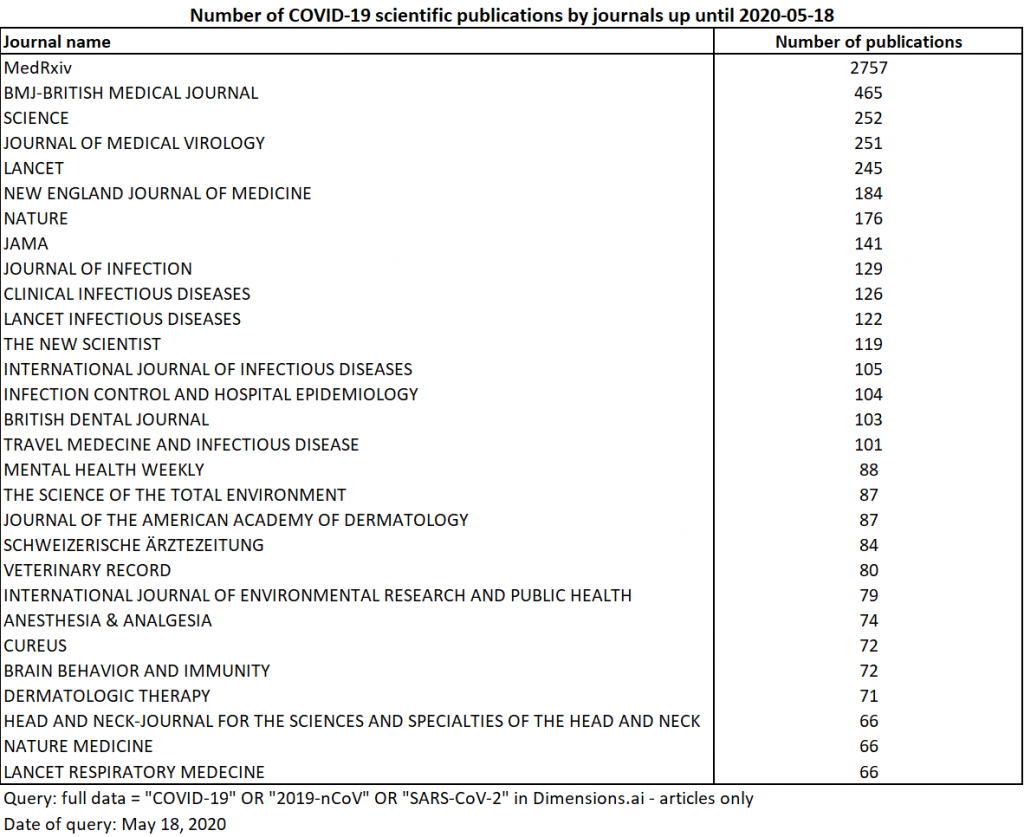
At the same date, an additional search on the Dimensions database with the same keywords returns 4931 preprints and 24 801 articles and chapters. 1804 preprints come from SSRN Electronic Journal and 846 from ArXiv. The main associated fields are medicine and public health, microbiology and clinical sciences. Since the humanities and social sciences have not been excluded from this research: the result also includes contributions in economics (nearly 400 preprints and 290 articles and chapters). For published articles, the main journals only partially coincide with those of the WoS (Table 6). The figures differ due to the fact that the search focuses on publications’ full text when available, whereas with the WoS, it is only possible to search for keywords in the titles, abstracts and keyword list associated with the publications. The indexing time is also faster on Dimensions.
Now let’s move to geography!
The geography of Covid-19 research
March 23, 2020
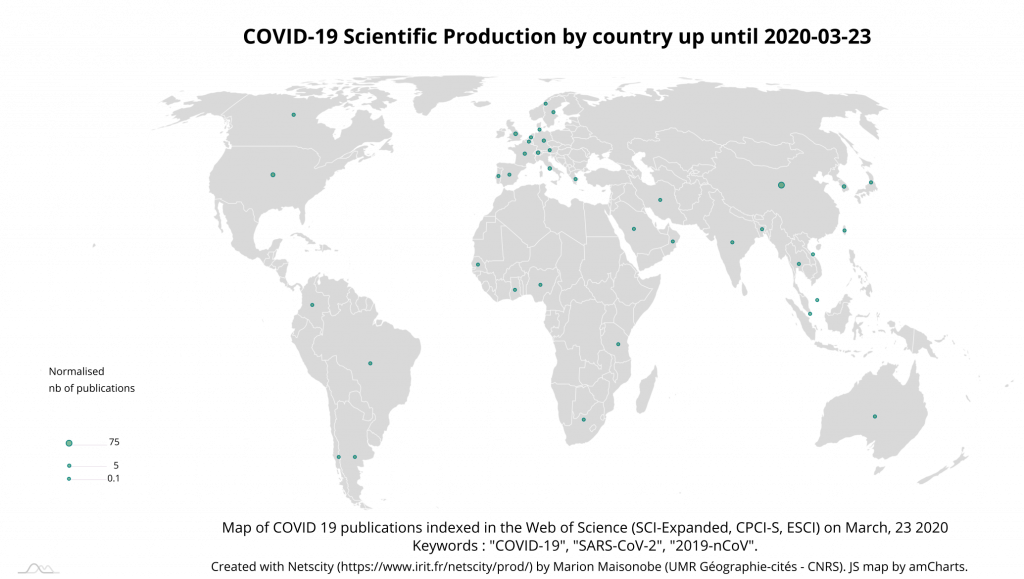
As of March 23, the publications that can be geographically referenced (177 out of 197) come from 39 different countries (Table 7).
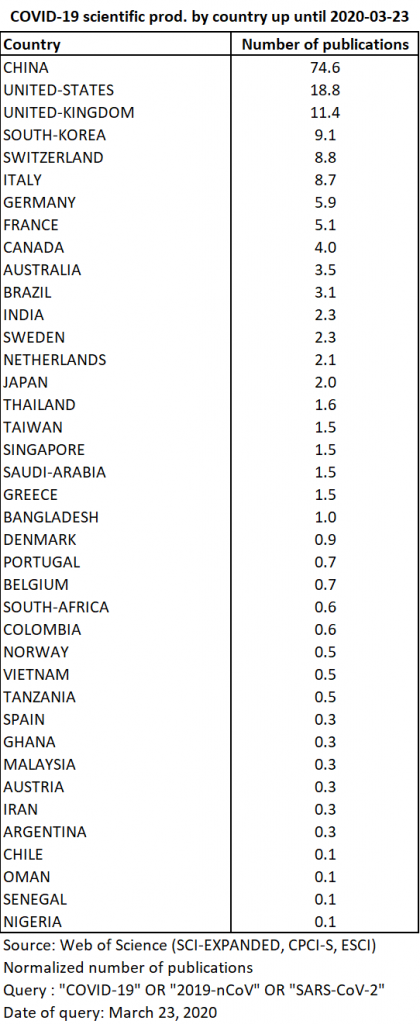
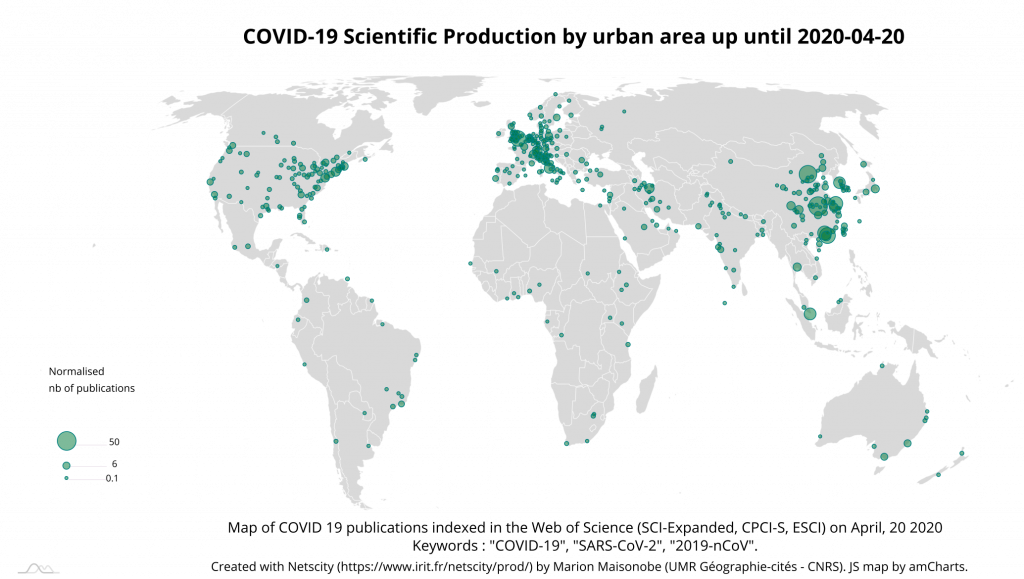
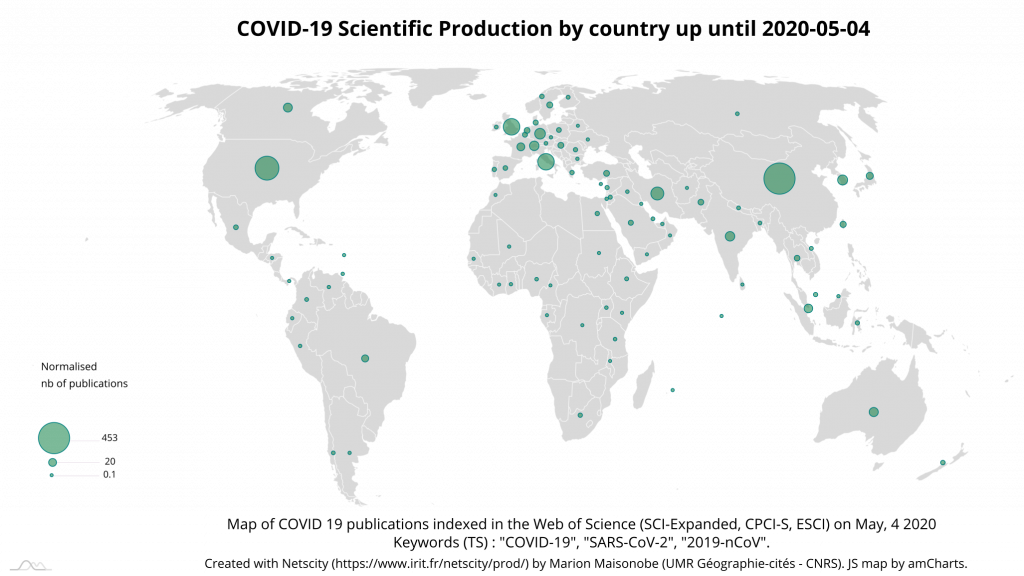
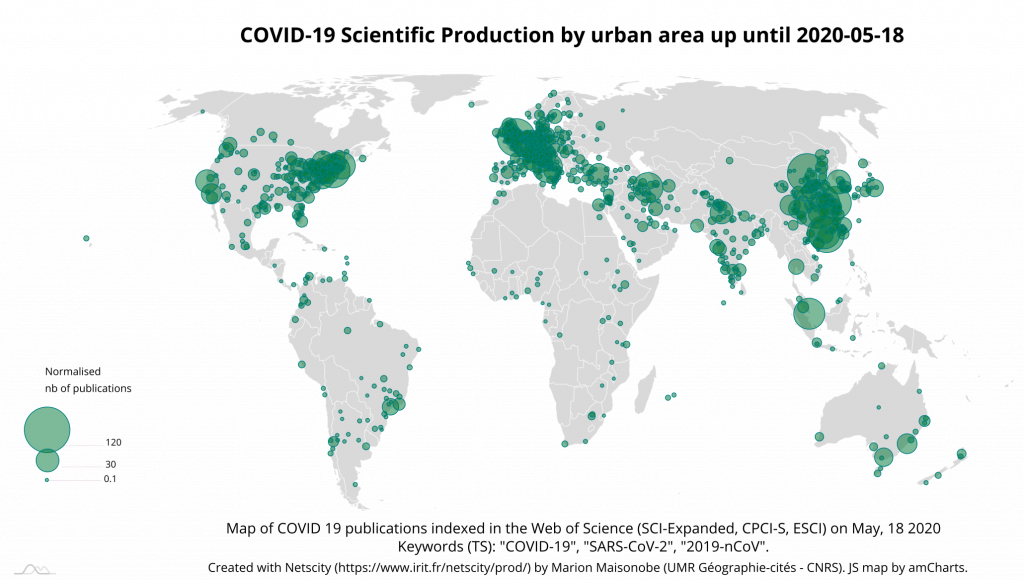
The top 5 countries produced 69% of all publications on the subject. In descending order of production, these countries were China, the United States, the United Kingdom, South Korea and Switzerland. They were closely followed by Italy, Germany and France (Map 1).
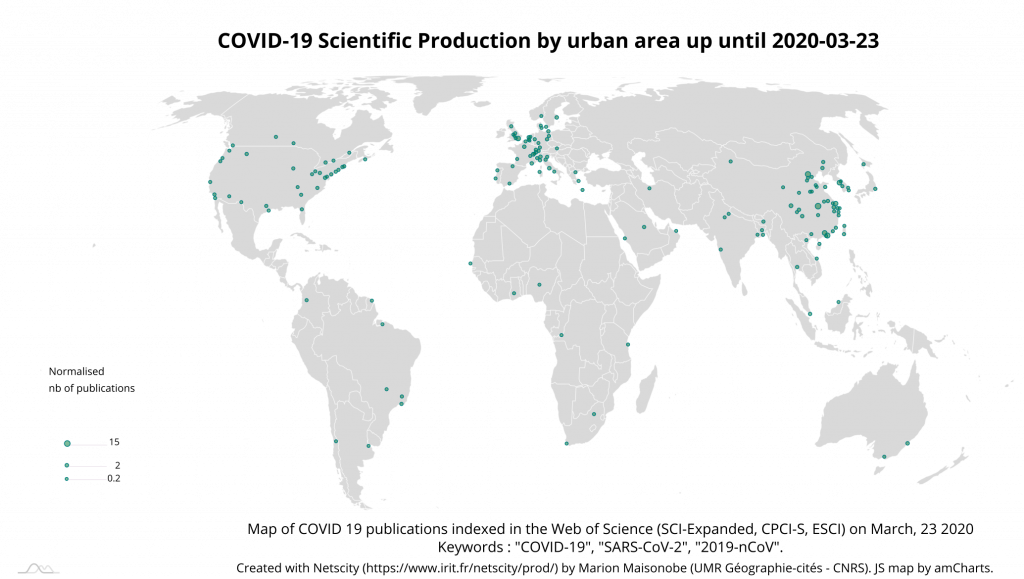
Production comes from 159 separate urban areas. The top 55 urban areas contributed nearly 80% of production (Table 8).
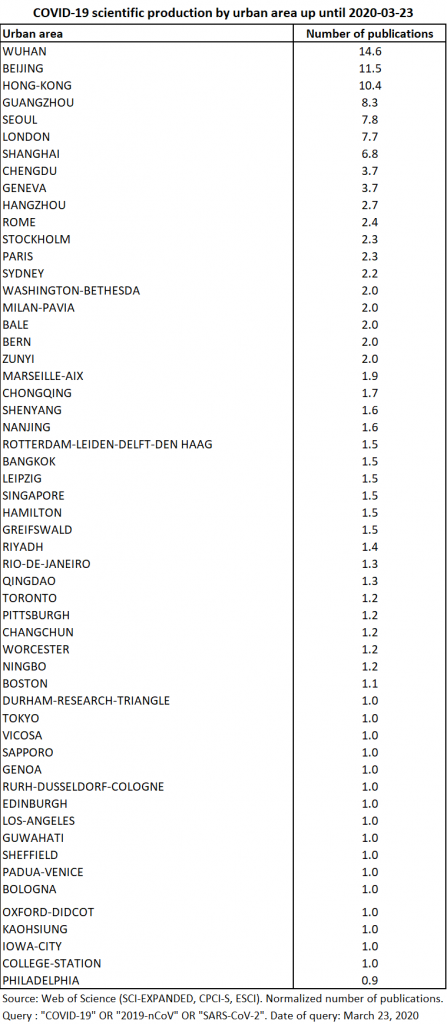
Thanks to NETSCITY, the data is normalised so that when a publication comes from several different agglomerations, each one receives a fraction of the publication in proportion to the total number of participating agglomerations. To produce these statistics, the urban level considered is that of the agglomeration in the sense that we have grouped together the central city and its suburbs (see the methodology explained here). The main reporting urban areas are Wuhan, Beijing, Hong Kong, Guangzhou and Seoul. The primacy of the city of Wuhan and the fact that the top 5 cities are Asian suggests that the geography of research in this area is directly linked to that of the epidemic (Map 2). These agglomerations are followed by London, which, at this date, is not the European city most affected by the epidemic. It should therefore be seen as having a special place in the scientific fields concerned and as home for many scientific journals (to date, half of London’s publications are editorials).
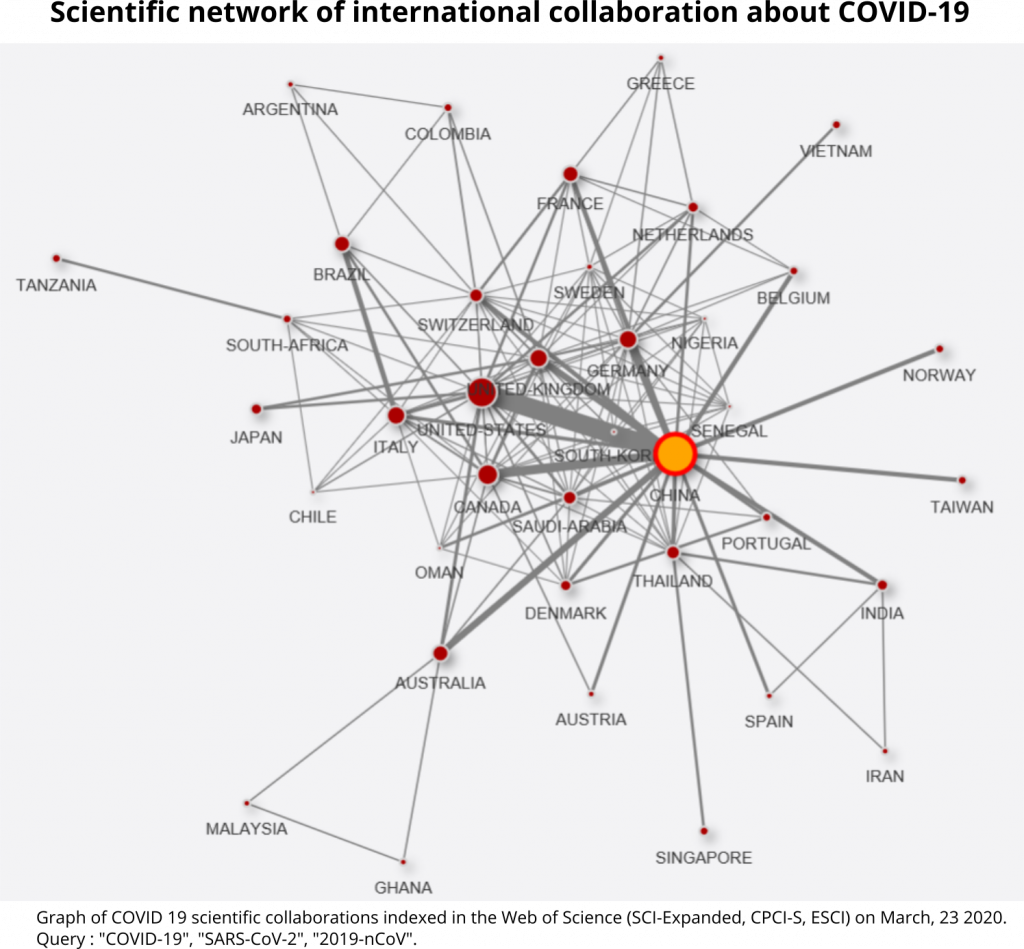
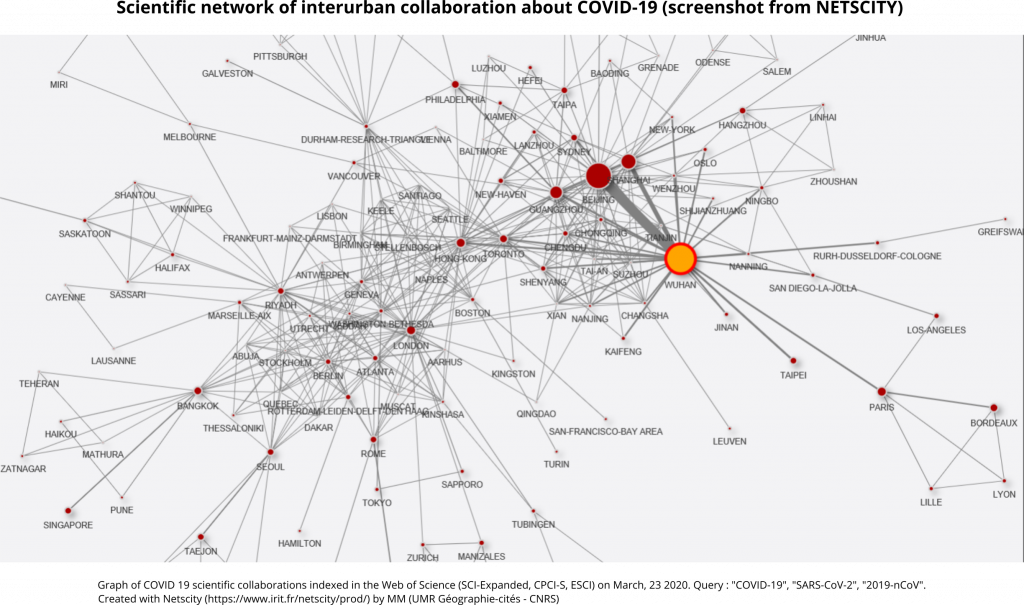
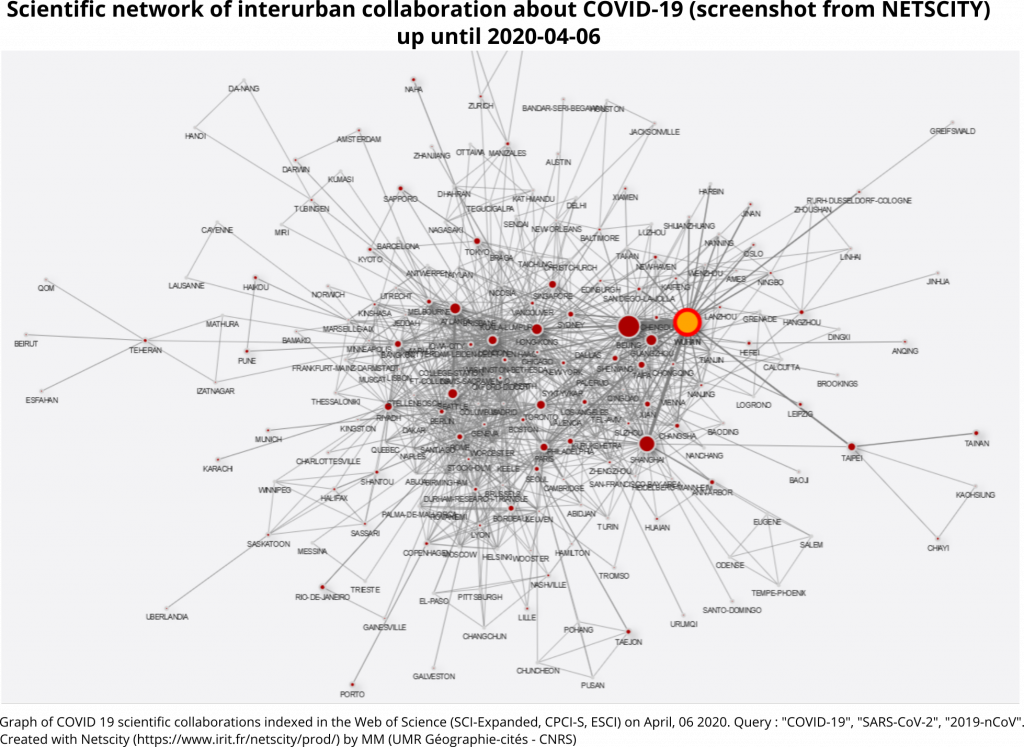
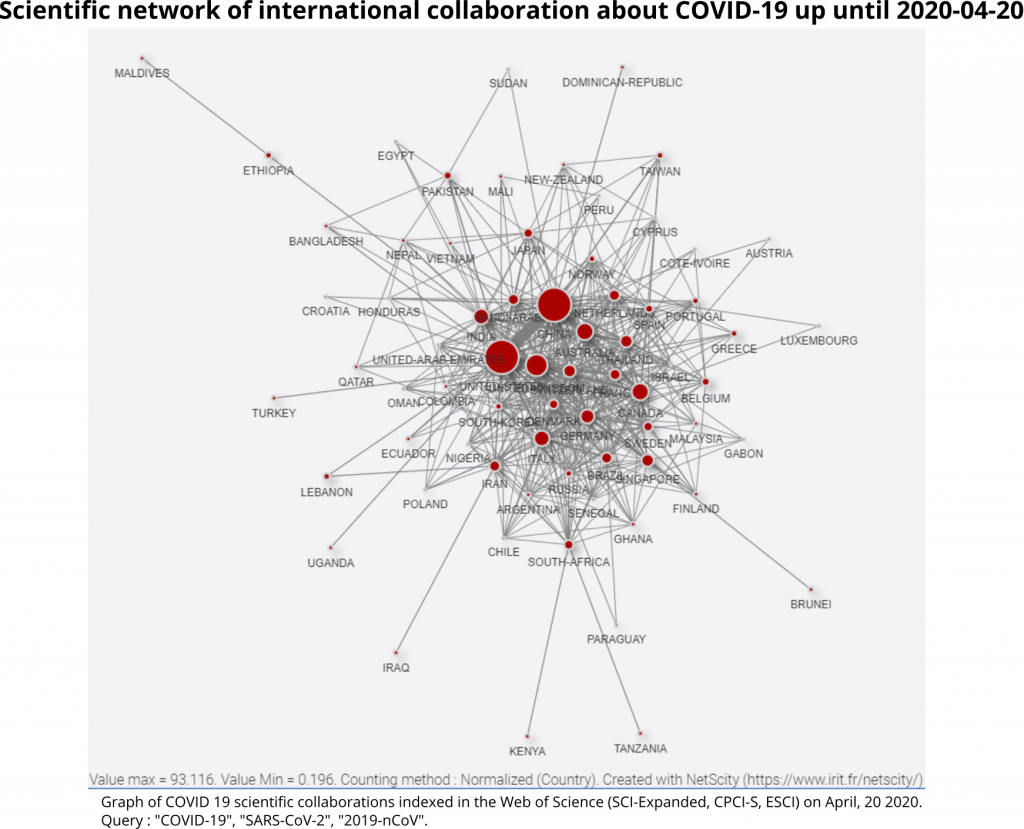
Of the 177 publications, 96 were signed from at least two different agglomerations and 10 were affiliated to more than 6 agglomerations. This density of co-publications makes it possible to focus on networks of cooperation between places. At the country level, the main collaborative links are between China and the rest of the world: United States, Canada, Australia, Germany, United Kingdom, Belgium, France. Italian scientists have collaborated more specifically with the United States and Brazil (Graph 1).
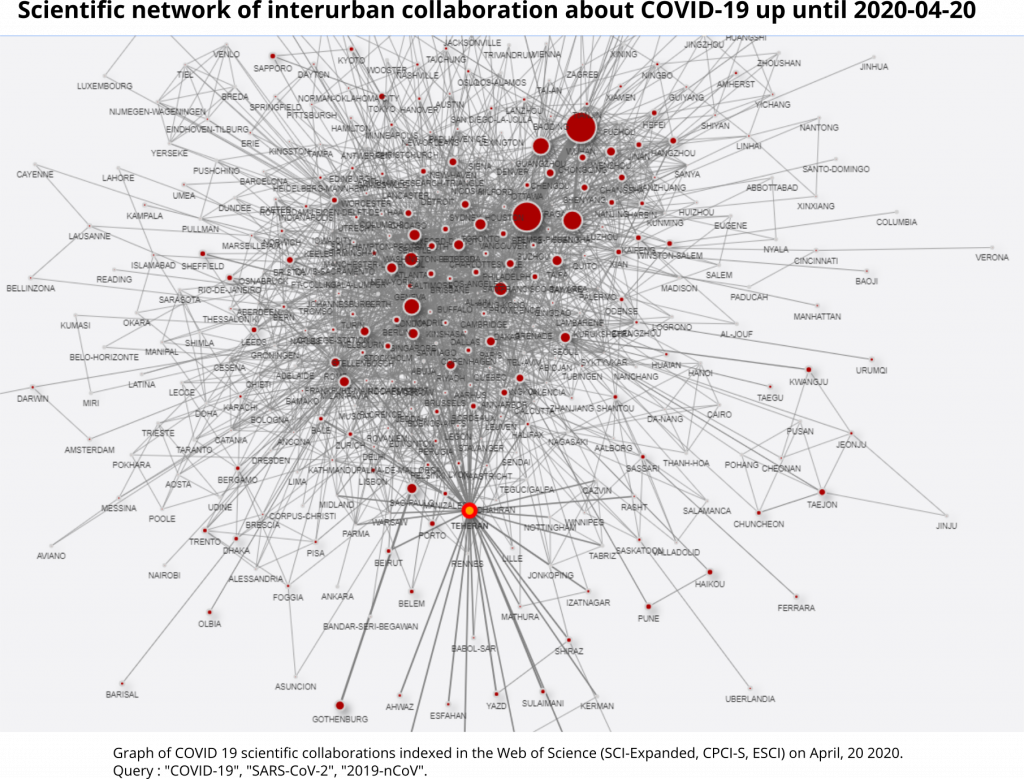
At the interurban level, sub-national collaborations are predominant (in China: Wuhan-Beijing and Wuhan-Shanghai links; in France: Paris-Bordeaux link – cities of the first french Coronavirus patients; in Korea: Seoul-Taejon/Daejeon link). Then, there is renewed international cooperation between Rome and Rio; Atlanta and Riyadh; New Haven and Sydney; Copenhagen and Porto; Paris and Wuhan; and between Geneva and Shanghai (Graph 2).
April 6, 2020
As of 6 April, the publications that can be geographically referenced (381 out of 442) come from 57 different countries (Table 9).
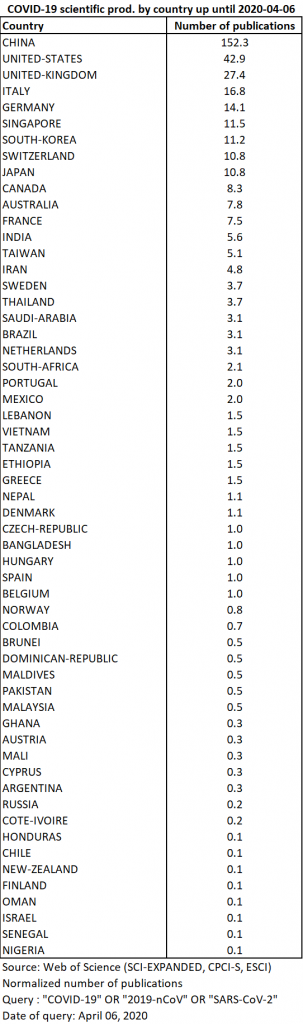
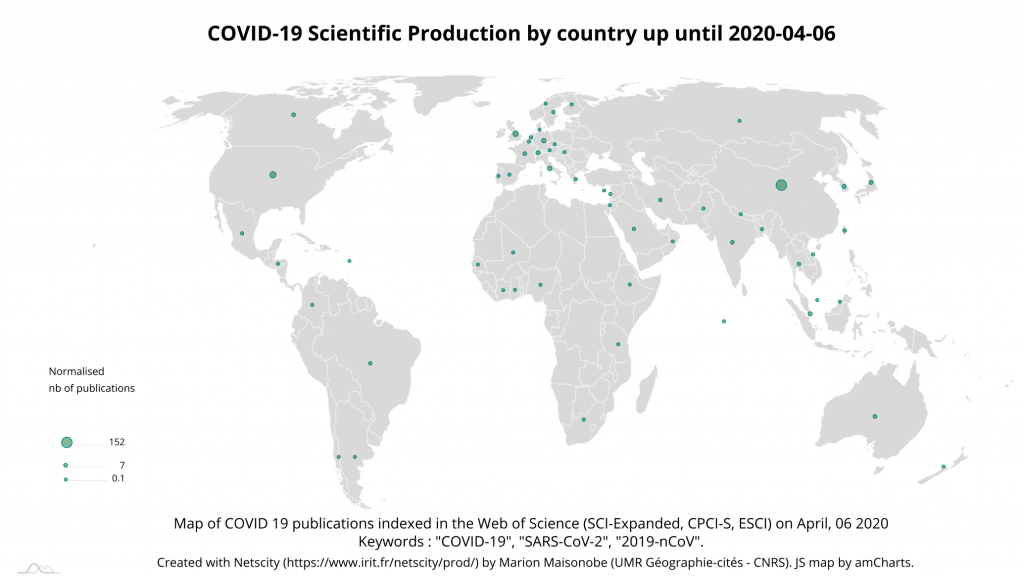
The top 5 countries now account for 66% of all publications on the subject, indicating that production is less concentrated than 15 days earlier. The top three countries remain China, the United States, and the United Kingdom. On the other hand, South Korea and Switzerland are overtaken by Italy, the European country most affected by the epidemic, and Germany (Map 3).
Production comes from 262 separate urban areas (that’s one hundred more than 15 days earlier!). The top 54 urban areas contributed nearly 70% of the production, also indicating a deconcentration shift in production between cities (Table 10).
The main reporting urban areas are Wuhan, Beijing, Shanghai, Hong Kong, and Guangzhou. London and Singapore are ahead of Seoul, which was the fifth most publishing city 15 days earlier (Map 4). Tokyo’s normalized number of publications has increased from 1 to 5, propelling the Japanese metropolitan area among the 10 most publishing cities on the subject. A few urban spaces stand out in the southern hemisphere, whose dynamics will be interesting to follow in the coming weeks, especially Melbourne and Sydney. Riyadh, Tehran and Beirut in the Middle East are also active, no doubt influenced by the importance of the epidemic in Iran.

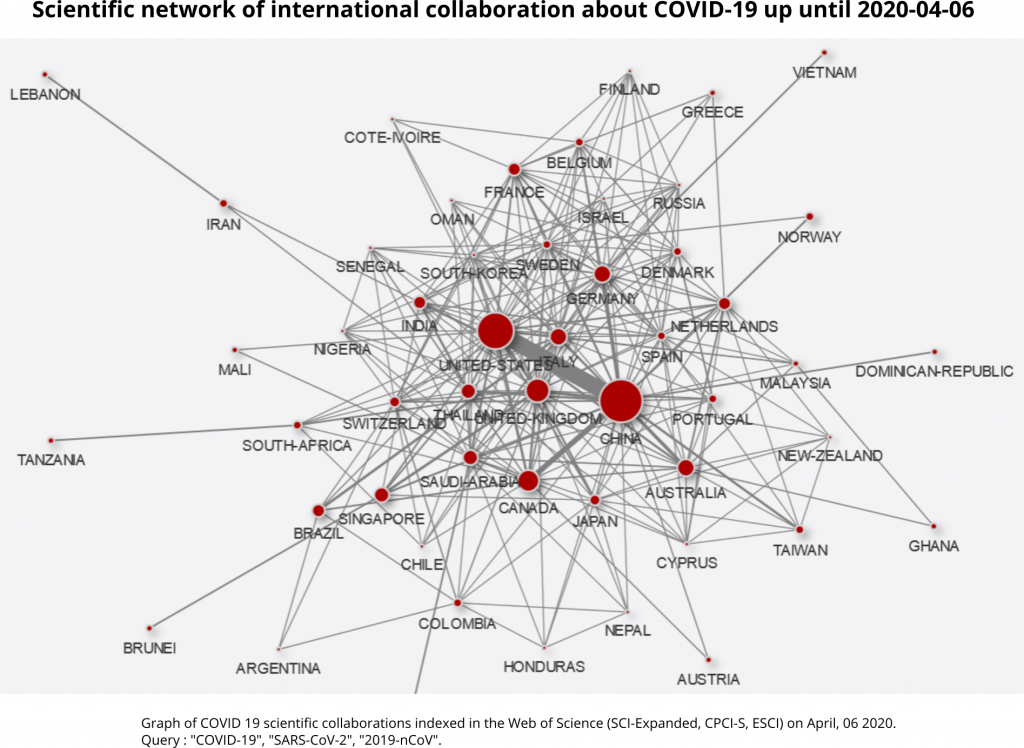
Of the 381 publications, 187 were signed from at least two different agglomerations and 20 were signed from more than 6 agglomerations. At the country level, the main collaborative links remain between China and the rest of the world. The United Kingdom is developing cooperation with the United States and Singapore. India (Pune in particular) is connected to China and Thailand. Tanzania is integrated into the global scientific network through one co-publication with South Africa. Similarly, Lebanon is connected to the network through Iran (Graph 3).
At the inter-city level, sub-national collaborations remain important, especially between Chinese cities. In addition to those recorded 15 days earlier, there is privileged cooperation between Atlanta and Seattle in the United States, as well as between Sapporo, Naha and Tokyo in Japan. In addition, there is a very large number of new international cooperations. Links between Toronto and Xian, London and Singapore, Ann Arbor and Shanghai are proving important (Graph 4).
April 20, 2020
On April 20, 2020, out of the 1095 publications retrieved from the Web of Science, 886 contain addresses (professional affiliations) allowing the geographical location of their authors. The remaining 209 publications are mainly news briefs, editorials and letters.
The 886 publications retrievable as of 20 April come from 77 different countries (Table 11).
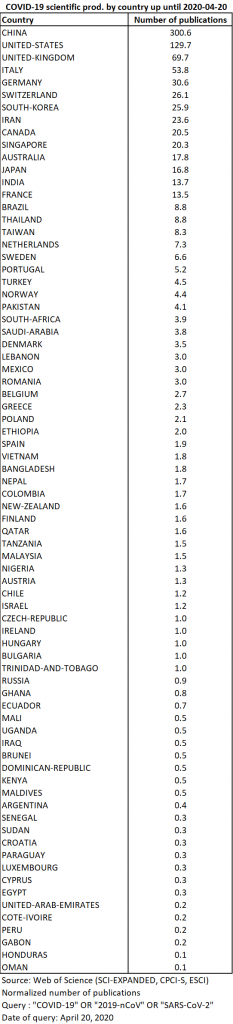
While publications from China doubled between 6 and 20 April, those from the United States and Italy tripled and those from Iran increased fivefold. The number of contributions from the United Kingdom, Switzerland and Germany also more than doubled over the period (Map 5). On the other hand, despite the importance of the epidemic in Spain, the participation of this country in scientific production related to the disease remains very low.
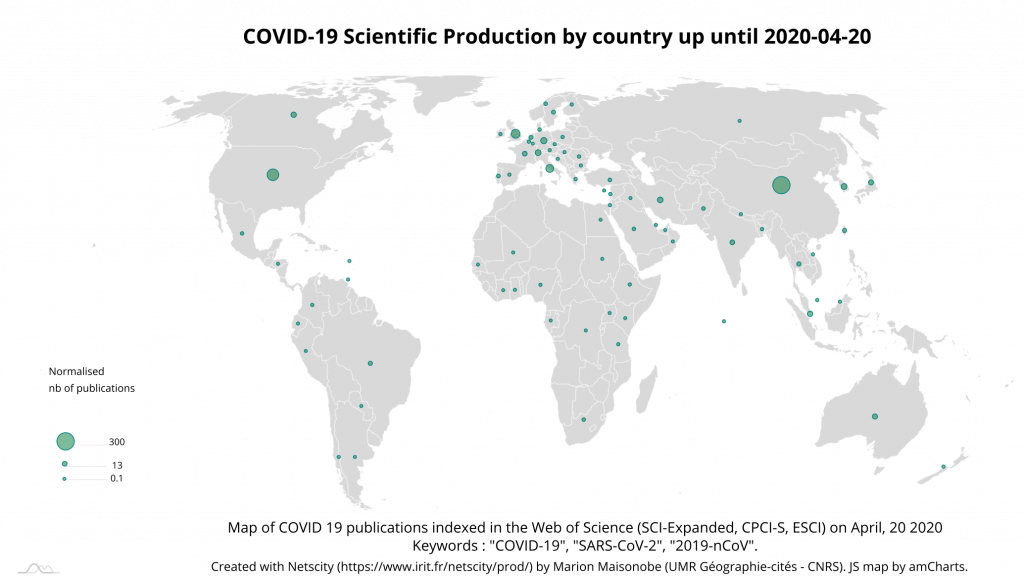
The top 5 producing countries are the same as 15 days earlier and again account for 66% of the total. In the top 10, Singapore is overtaken by Switzerland, South Korea, Iran (which joins the top 10) and Canada. Japan leaves the top 10 and finds itself in 12th place, behind Australia. The slower increase in production in Asian countries seems to confirm a shift in the centre of gravity of research.
Even more than a diffusion of the theme to new countries, we observe a multiplication of the number of urban areas involved. The number of urban areas involved has risen from 262 to 456. The first 54 urban areas now account for only 62% of the total output, indicating the rapid continuation of the spatial deconcentration movement previously identified (Table 12).
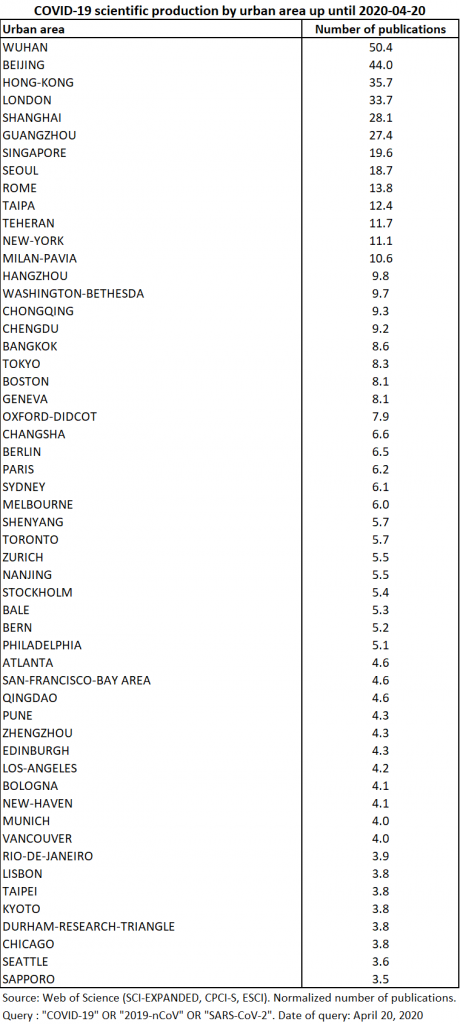
London confirms its position as the leading publishing city on the subject in Europe by joining the world’s top 5 instead of Guangzhou. Rome and Taipa (an island located opposite the Macao peninsula in China) saw their contributions triple and are now among the top 10 publishing cities, to the detriment of Chengdu and Tokyo. Tehran records an important jump from 34th to 11th place (Map 6).
Of the 886 publications, almost half (431) were signed from at least two agglomerations and almost 50 were affiliated to more than 6 agglomerations. At the country level, the main collaborative links remain between China and the rest of the world. The United States’ network with the rest of the world is becoming significantly denser and the link between India and Thailand is growing stronger (Graph 5).
Sub-national collaborations remain important, particularly in China, where the main cooperation is between Beijing and Wuhan. In the United Kingdom, London-Sheffield and London-Bristol collaborations are developing (Graph 6).
May 4, 2020
Of the 1913 publications, 1580 have one or more associated addresses. These 1580 publications come from 88 different countries, 10 more than on April the 20th (Table 13).
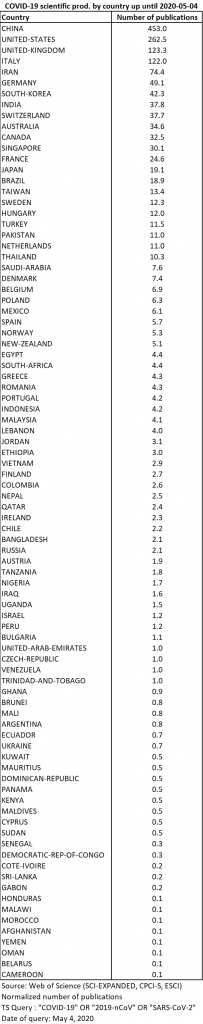
The rate of increase was lower than in the previous period. With a growth rate of 1.5, China remains in the lead, but its lead is narrowing in relation to the United States, whose output is doubling. Italy is consolidating its fourth place with 2.3 times more publications than on April the 20th. Iran’s output triples, putting it in the top five countries with the most publications on the subject, ahead of Germany. South Korea is moving up ahead of Switzerland, while India is making significant progress, making it into the top 10 for the first time.
These developments seem to indicate that although the epidemic has slowed down in the Eastern countries in recent weeks, their involvement in research has nevertheless continued: this can obviously be explained by the gap between the rate of production of publications and their rate of publication. However, these trends vary from one country to another and that, as far as Japan is concerned, we do not observe a continuation of growth comparable to that observed in South Korea. A rapid development of research is also remarkable in several Eastern European countries (Hungary and Turkey in particular). In the southern hemisphere, Australia and Brazil continue to stand out, occupying 10th and 15th place in the world, respectively (Map 6).
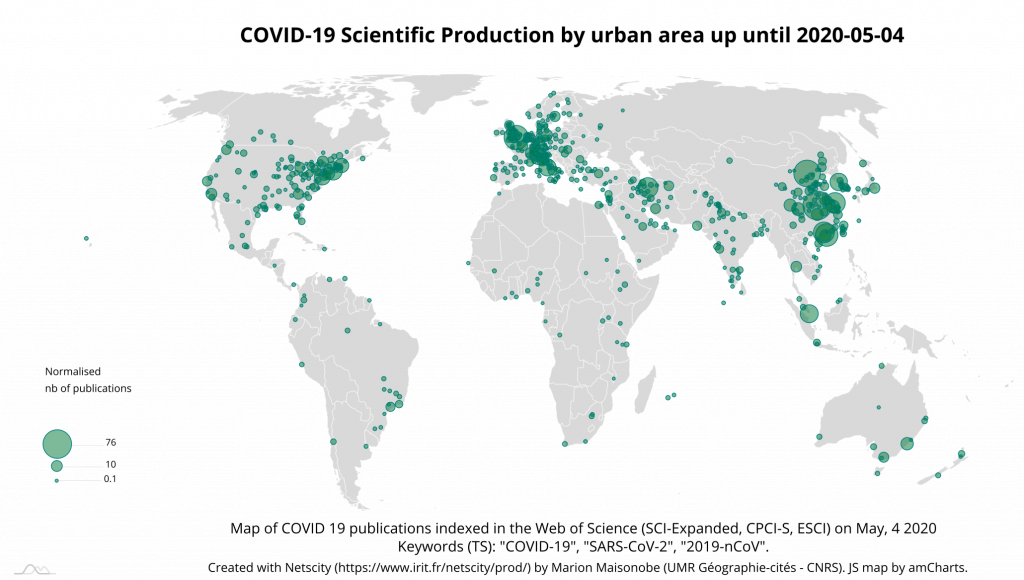
Spatial diffusion continues at the level of urban areas, at a slightly slower pace than before. The top 55 urban areas now account for just under 60% of total output (Table 14). A total of 653 urban areas are concerned, compared to 456 as of 20 April.
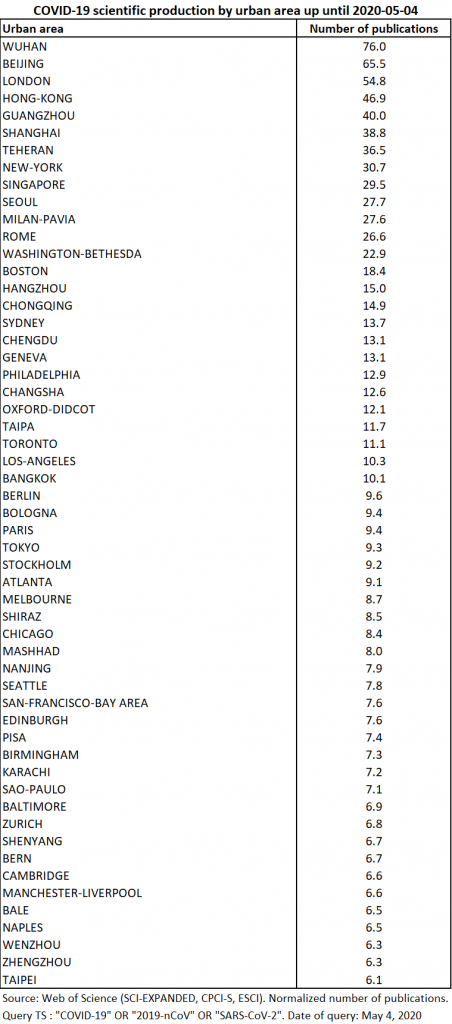
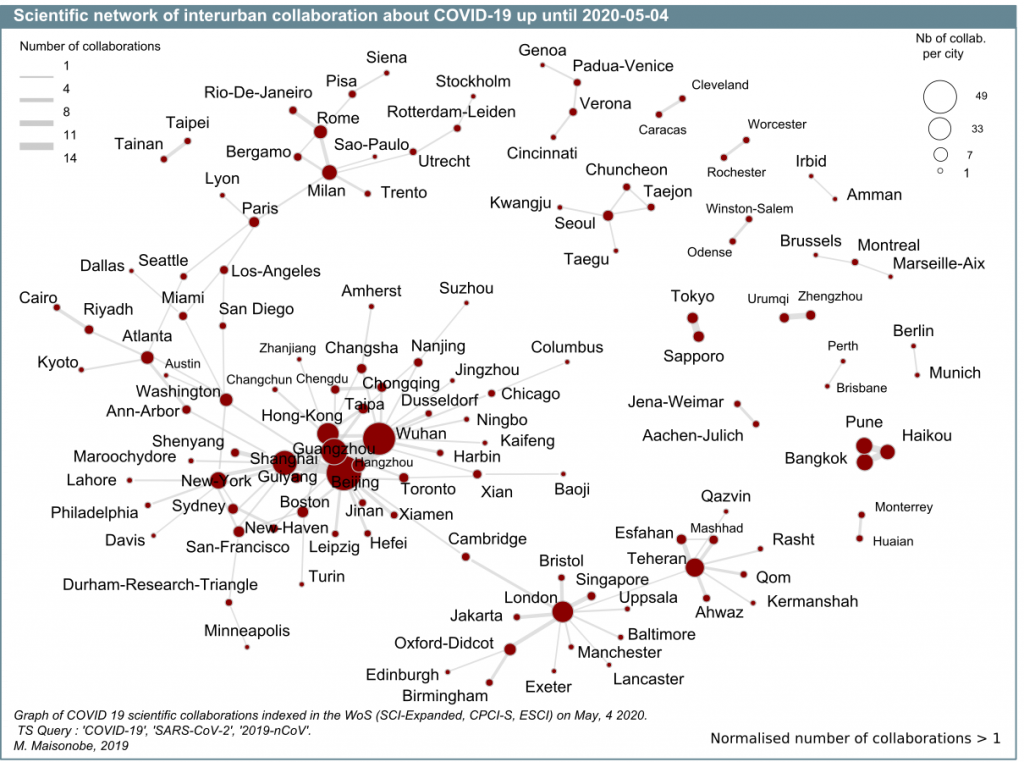
The British capital confirms its lead at the world level, with a level of participation close to that of the main Chinese cities involved (Wuhan, Beijing and Hong Kong). New York and Teheran are in the top 10: their contribution is 3 times greater than on April the 20th. Most of the Italian, American and Iranian cities involved doubled their contribution over the same period. The growing involvement of several countries (United States, Italy, Iran, Brazil) is thus reflected in the scale of their entire national research system (Map 7). The evolution of scientific collaboration links between cities also bears witness to this (Graph 8).
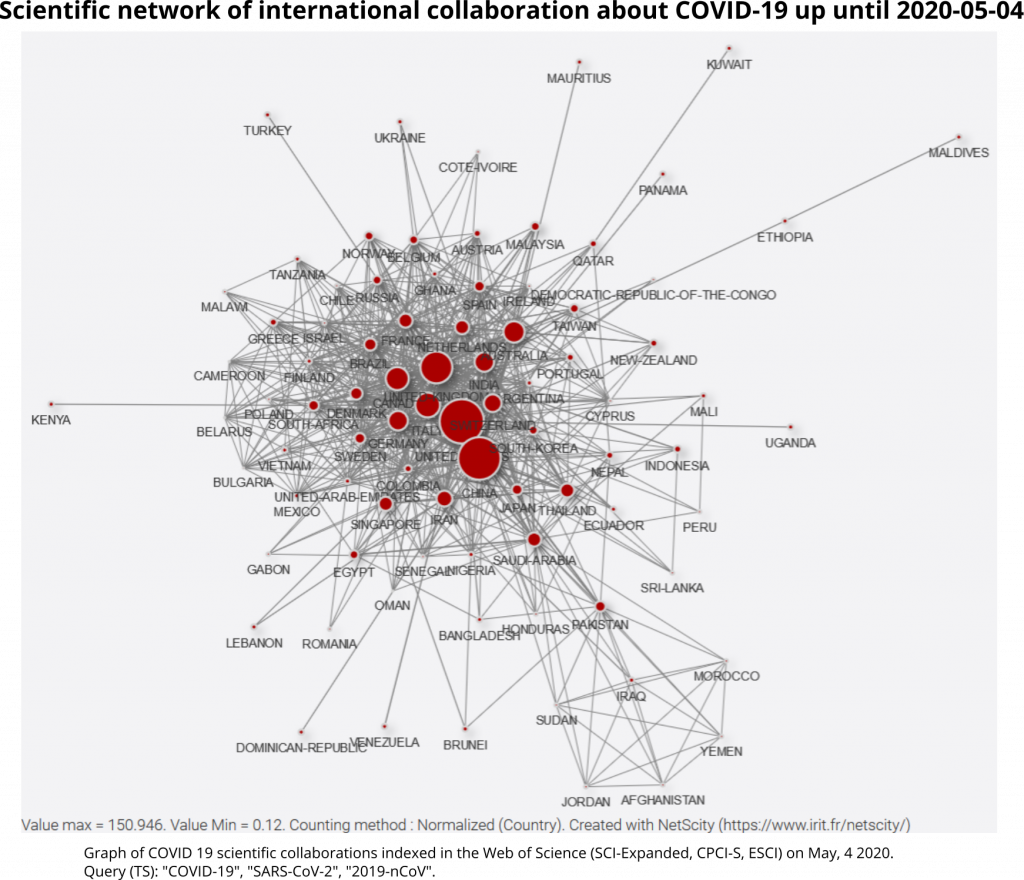
756 publications are the result of cooperation between scientists located in different urban areas (48%), and 399 are the result of international cooperation (25% of the total), indicating that the share of intra-national cooperation remains the majority. The main cooperation links between countries are between China and the United States and between these two countries and the United Kingdom. Italy and Iran are developing more links with the United States and the United Kingdom than with China. On the other hand, Australia, Canada and Germany have so far cooperated more with China than with the United States (Graph 7).
The detail of the relations between cities makes it possible to identify privileged international links as well as important domestic connections. As the graph of all the relations between cities becomes too dense to be visualized as a whole, we consider the most important links (at least two co-publications). On the right side of the image, several small groups of cities with strong cooperation (South Korean group, German dyad, Japanese dyad etc.) can be seen. Some of these small groups bring together cities from different countries (Pune-Bangkok-Haikou, Brussels-Montreal-Marseille). On the left side of the image a large component stands out, including Chinese cities, foreign cities connected to it, as well as their partners: Iranian cities connect to this network via British cities and Brazilian cities integrate via Italian cities (Graph 8).
May 18, 2020
Web of Science
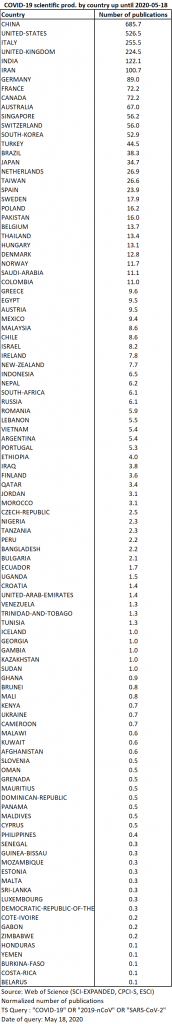
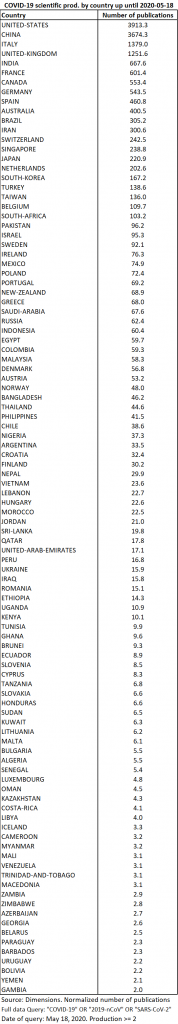
Of the 3498 publications retrieved from the WoS, 2907 contain geographic information that can be used to locate them (83%). These 2907 publications come from 105 different countries, 22 more than on May the 4th. The list of countries most concerned has undergone some significant changes (Table 15). The United States and Italy are doubling their contributions. The number of Indian contributions has again more than tripled. India is now in the top 5 instead of Iran. In Iran, the number of publications increased slightly less than in the previous period. In the top 10, France and Canada took the place of Switzerland and South Korea. France’s participation is 3 times higher than on May the 4th and Spain, although still far behind (19th place), saw its participation multiplied by 5.
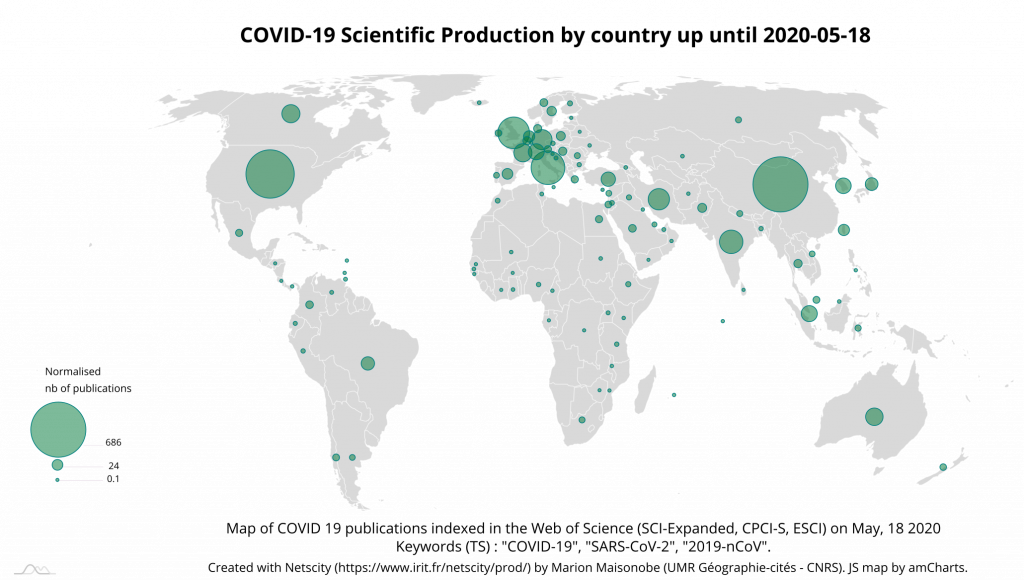
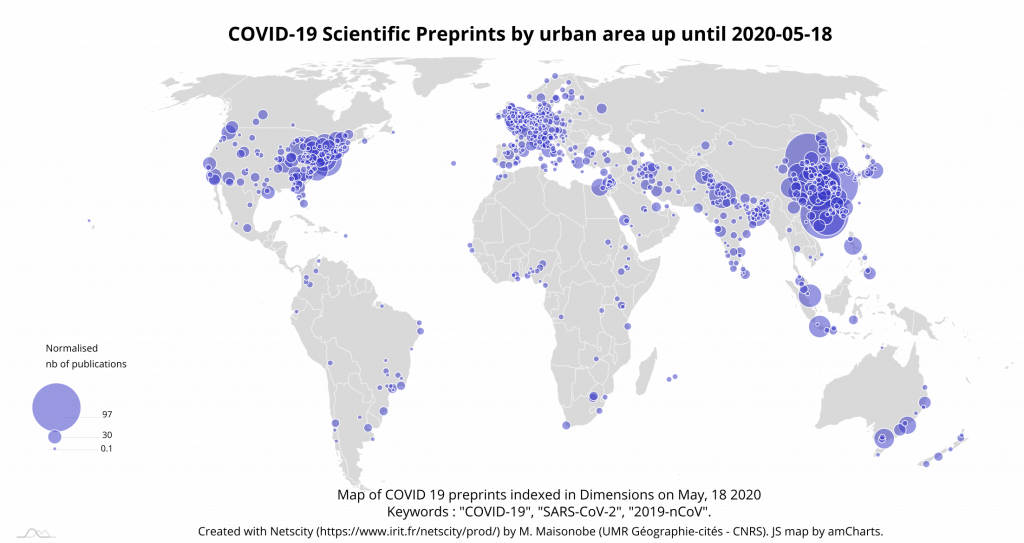
The production map at country level shows the worldwide expansion of research activity. There are only a few countries on the African continent and in South America from which there is as yet no contribution to COVID-19 research (Map 8).
As of May 18, there are 927 urban areas involved, twice as many as a month earlier. The top 55 cities now account for only 53% of total production, but the two largest Chinese cities involved, Wuhan and Beijing, together produced 7% of the total (Table 16).
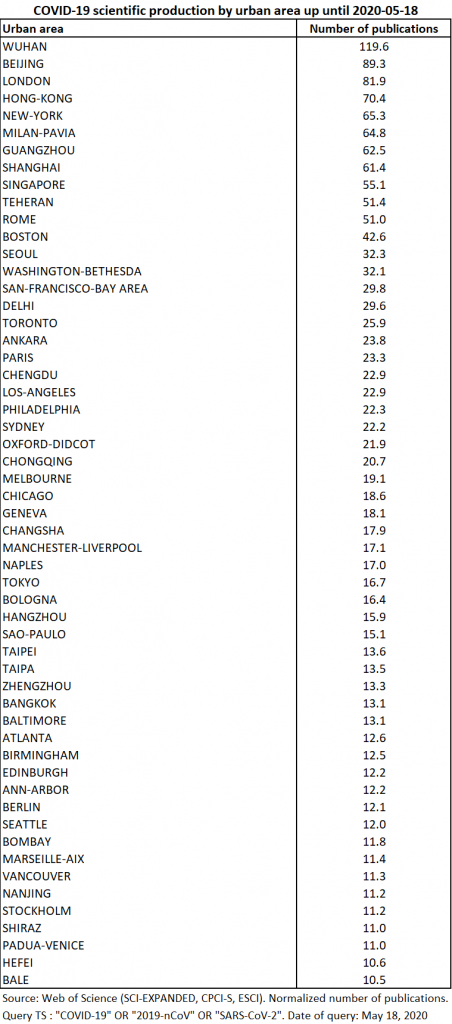
The participation of the Milan-Pavia, Boston, Toronto and Paris conurbations is 2.3 times greater than on May the 4th, and that of San-Francisco has quadrupled. The latter is therefore well ahead of Los Angeles, which was 15 days ahead of it. The cities of Delhi and Ankara make their appearance among the most involved cities. Manchester-Liverpool and Napoli also stand out for their significant growth in contribution. The map of participation at city level shows the very strong expansion of the theme in Europe and the eastern part of Asia (Map 9). However, Russia seems to be little involved in the scientific production effort that we are measuring.
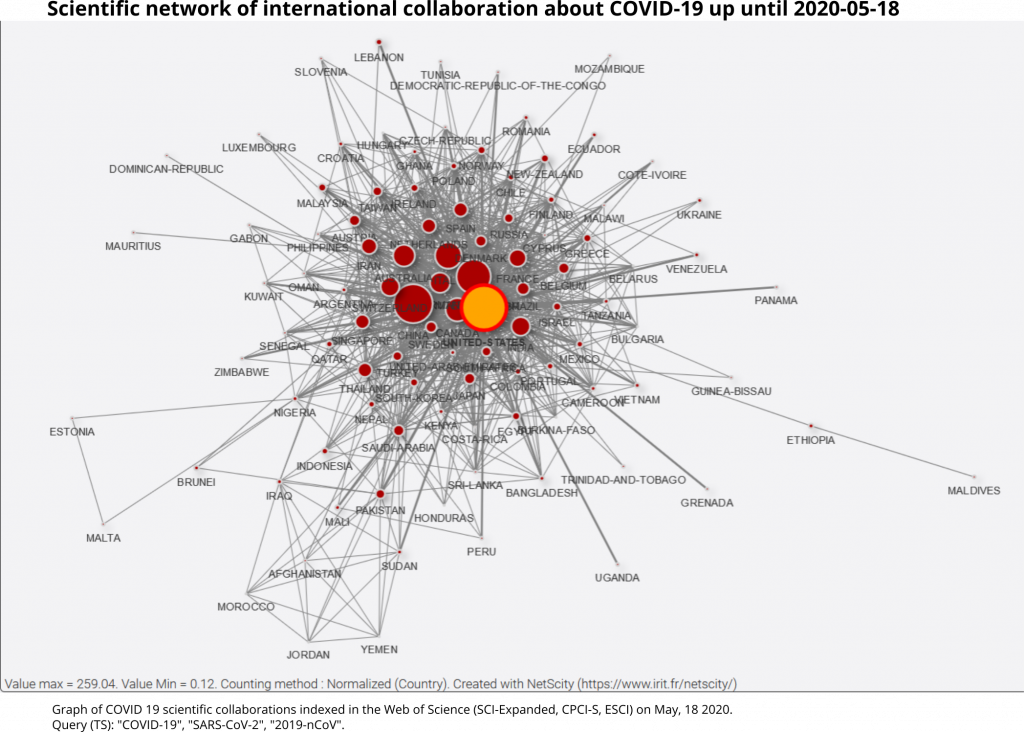
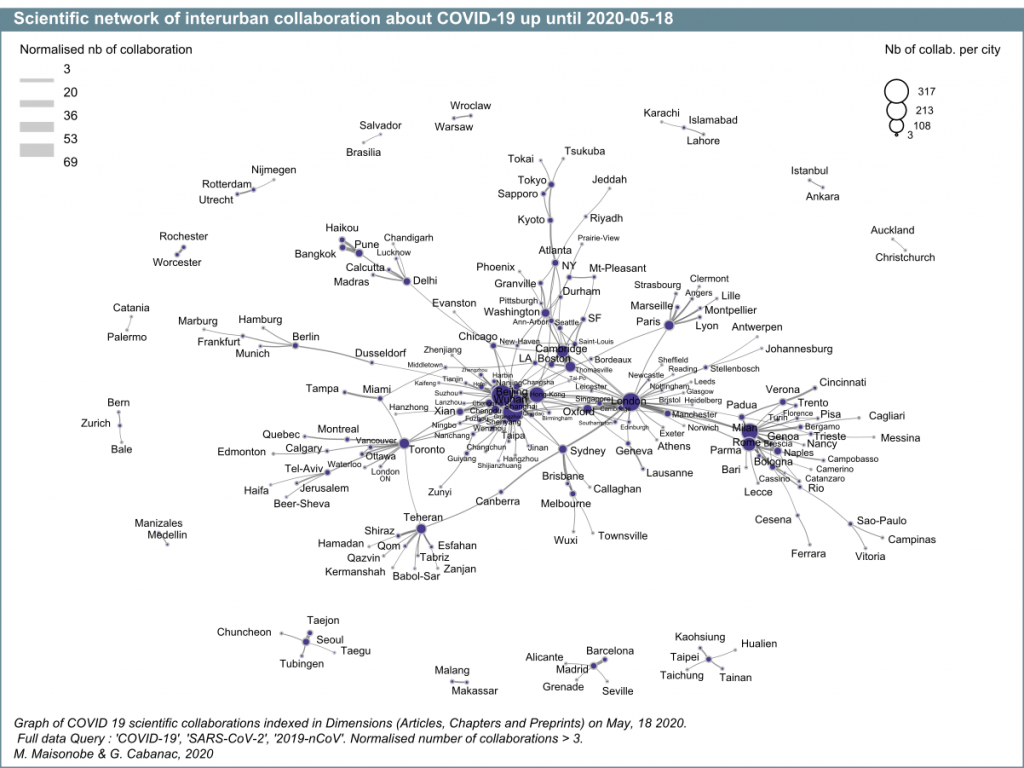
If we look at collaborations, we can see that the share of cooperation has decreased very slightly, with 47% of cooperation between distinct urban areas and 24% of international cooperation respectively. The United States appears to be intensifying its cooperation with Italy, Canada and Australia. The United States (in yellow) now appears to occupy a more central place than China in the global network of collaborations on COVID19 (Graph 9).
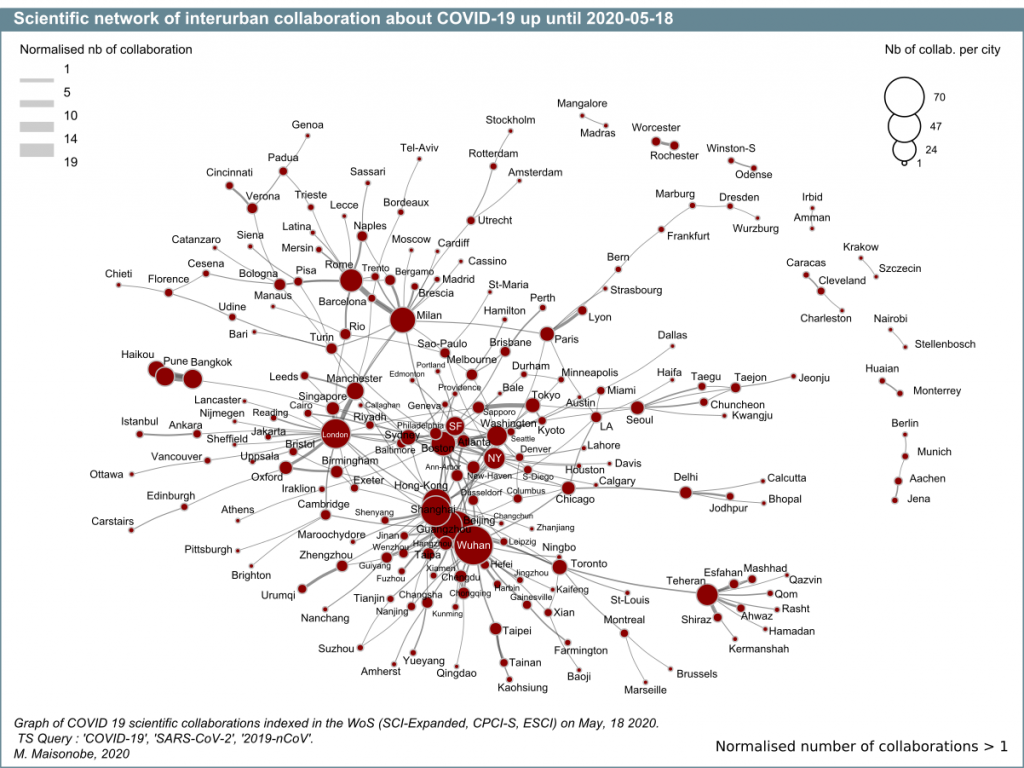
Finally, the network of the main co-publishing links between urban areas increased from 126 cities on 4 May to 206 cities on 18 May (fixed threshold). Together, these cities account for 39% of total co-publications. For readability reasons, only the most important relationships are represented in this figure (graph 10). Compared to graph 8, it can be seen that several previously isolated small clusters (South Korean cluster, German dyad, Japanese dyad, etc.) are now linked to the main component. The Korean cities are connected by the Japanese cities, which are themselves connected to the American cities. The conurbations of Milan-Pavia and London appear to be central and highly connected not only with other European cities, but also with cities outside Europe. Indian cities are integrated into the global network via Singapore for Pune, and via Chicago for Delhi.
Dimensions
If we now examine the data extracted from Dimensions, we find that 23% of articles and chapters and 35% of preprints were indexed without the authors’ affiliation. Of the remaining 20,838 documents (17,738 articles and chapters, plus 3,100 preprints), most have affiliations that do not specify the author’s city, making it more difficult to locate them geographically. Despite this limitation, we were able to locate 2,270 preprints and 14,865 articles and chapters (82% of publications with addresses). The preprints came from 91 different countries and 661 urban areas, while the total corpus (preprints + articles + chapters) came from 131 different countries and 1,776 urban areas. Only 29% of the preprints were the result of cooperation between scientists located in distinct urban areas. On the other hand, out of the total corpus extracted from Dimensions, 42% are co-authored documents from several urban areas and 20% are the result of international cooperation.
The table showing the distribution of production by country has some interesting differences from the WoS data. In the data covered by Dimensions, production from the United States is more important than Chinese production. Also, the participation of France and Spain is much more significant (Table 17). For an analysis of the differences in coverage between the two bases, which may explain these discrepancies, see the work of Martin-Martin et al. 2020.
The first 55 agglomerations out of the 1,776 involved account for 50% of the production (Table 18). The top three agglomerations are also Wuhan, Beijing and London. In contrast, the European cities of Milan, Paris, Rome and Madrid, as well as the Canadian city of Toronto are much better placed. Their research effort places them ahead of the U.S. cities.
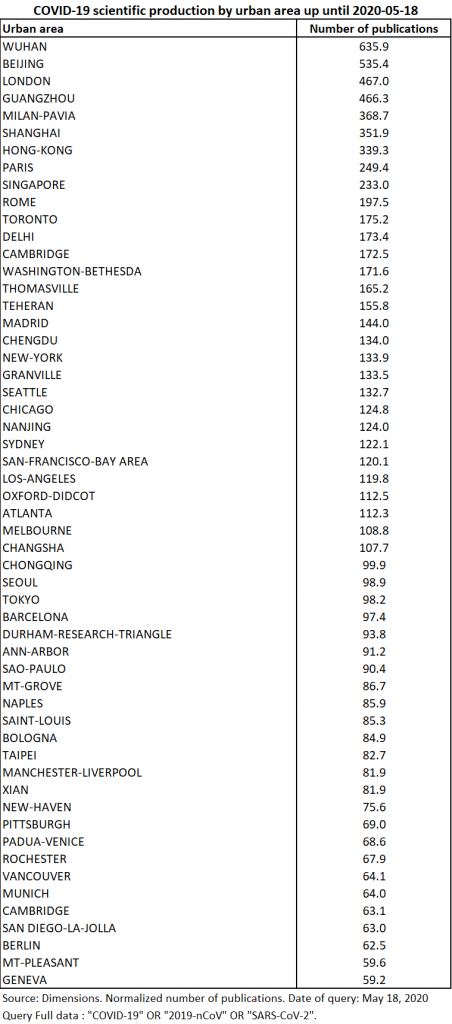
If we look only at the distribution of the 2,270 preprints, we find a geography closer to that of the WoS with Chinese, British and American cities in the lead (Map 10).
Finally, an analysis of the network of the main cooperation between cities (the first 300 links, i.e. 30% of co-publications) reveals a fairly clear global organization where the importance of domestic links can be clearly seen. The central role of London and Milan, which is already noticeable from the WoS data, is confirmed. Chicago and Toronto also occupy an intermediary place in this network (Graph 11).
Understanding this geography
It may come as a surprise that we are dealing with such a dense network of cooperation at a time when the question of research is only just emerging and when we are in a situation where opportunities for exchange are weakened by borders’ closures.
To better understand what we are observing, it would be useful to differentiate between the different types of publications considered and to conduct interviews with the researchers involved. During the outbreak of the disease, cooperation with China proved essential both for the medical management of the crisis and for knowledge of the virus: chinese scientists having rapidly sequenced the genome, followed by those at the Pasteur Institute in Paris (Lemke, January 2020). The laboratories had to coordinate, share their results, schedule clinical trials and exchange biological specimens. This is the case with the Doherty Institute in Melbourne, which communicated at the end of January 2020 on the fact that it had succeeded in replicating the virus in the laboratory (University of Melbourne, January 2020).
In addition to the accelerated exchanges justified by the urgency of the crisis, we need to combine the pre-established exchanges between laboratories and researchers who are part of pre-existing scientific communities and who had already worked together before. One can think of the community of specialists in coronaviruses, which are a particular type of virus that Professor Bruno Canard (Aix-Marseille University) has been studying since the early 2000s (Sauvons l’Université, March 2020). Thus, within the ICTV (International Committee on Taxonomy of Viruses), there is the Coronaviridae Study Group with a majority of American, German and Dutch members.
The role of the historical laboratories in virology that are the Pasteur Institutes in Paris, Hanoi and Dakar as well as the Robert Koch Institute in Germany in monitoring the spread of the virus and in the search for vaccines is also worth mentioning. To learn more about the history of these two scientists and the institutes that took their names, see the book and documentary of the same name Pasteur and Koch: a duel of giants in the world of microbes. Finally, we note the coordinating role played by the STAG-IH (Strategic and Technical Advisory Group for Infectious Hazards), a committee of experts set up in 2005 at the time of the Ebola epidemic, which provides reports and advice for the World Health Organization.
Moreover, international cooperation is under particular scrutiny and appears essential in the context of the pandemic. Thus, the World Economic Forum highlights several interesting initiatives involving research centres located in Africa, including the African Coalition for Epidemic Research, Response and Training and the Partnerships for Enhanced Engagement in Research, which are likely to promote knowledge sharing and coordination on a global scale (Kituyi, 2020).
Two research teams specialized in scientometry are also exploring the dynamics of international cooperation on COVID-19 by comparing them to a pre-COVID-19 situation. For Zheng et al. the comparison relates to research carried out since 2000 on SARS and three other diseases: H1N1, Ebola and Zika (Zheng et al., 2020). It is observed that historically the most important collaborations on SARS were already collaborations between China and the United States. However, research efforts on SARS had decreased in all countries of the world in recent years. The preprint by Fry et al. explores in more detail the status of coronavirus collaborations between January 2018 and December 2019 by comparing it to the current status of international collaborations since the emergence of SARS-CoV-2 (Fry et al., 2020).
The intense activity of scientific production that we are witnessing has been accompanied by initiatives to make scientific literature available, including literature that predates December 2019. The knowledge base needed to make progress in this field is not limited to publications published since the emergence of the new coronavirus.
Complementary corpus
For those who would be interested in delving further into these questions, we can distinguish several corpus made available to researchers in recent months:
- The COVID-19 open research database (CORD-19), a free resource of more than 44,000 scientific articles, made available by the Allen Institute for AI and its partners. A sub-part of this corpus has been geographically analysed and is available as an online preprint ( Dousset & Mothe, 2020a; 2020b). In addition, the Neural Covidex project (University of Waterloo and NYU) provides automated means to explore this corpus. The Service for Science and Technology of the Embassy of France in the United States also offers a tool for interactive exploration of the geography of this corpus at the country and institutional level (Covid-19: CORD19 Publications Dashboard). It is also possible to explore the regularly updated COVID-19 Open research map, which connects the documents in its corpus based on a measure of similarity between abstracts (Vermej, 2020). The SciSight tool also offers very innovative ways to explore this corpus by taking into account cooperation between authors, between institutions and proximity between keywords (Hope et al., 2020). More generally, to explore the different exploration tools proposed from this corpus, you can consult the Allen Institute’s page dedicated to it as well as the Kaggle web platform (Allen Institute, 2020; Kaggle, 2020). On Kaggle, you will also find a selection of the most interesting contributions (Covid-19 contributions, 2020).
- All publications with the keyword “coronavirus” from January 2000 to March 2020 available on the PubMed database (6560 documents). These publications are being searched to extract semantic relationships using Gargantext software (ISCPIF, 2020) developed by David Chavalarias (interview in the CNRS journal, 2020). For further analyses of this type, the first results of Chaomei Chen can be followed using CiteSpace software (Chen, 2020). PubMed data are also being used by Jimi Adams and Ryan Light to explore cooperation and the geography of COVID-19 publications (Adams and Light, 2020).
- The publication database specially set up by the World Health Organization on COVID-19, which as of May 18, 2020 includes: 16,461 publications including 448 from the BMJ, 200 from Science, 176 from The Lancet and 132 from the journal Nature (WHO, 2020).
- The open archives, including a database of 3625 preprints deposited on MedRxiv and BioRxiv relating solely to the new coronavirus (MedRxiv, 2020). For a review of the number of contributions related to the new coronavirus in open archives, see the analyses by Nicholas Fraser and Bianca Kramer (Fraser and Kramer, 2020). In the United-States, the Harvard library is fast-tracking the deposit of Covid-19 research into DASH. In France, the HAL open archive also offers facilitated access to publications related to the epidemic that have been deposited there (Magron, 2020, HAL, 29 avril 2020 ). The increase in the use of open archives in the Social Sciences and Humanities is also noteworthy. Thus the SocArxiv platform of open archives in sociology recently welcomed the very good number of preprints deposited in April 2020, among which 68 on COVID (SocArxiv, 2020).
- A review of the open access literature from several databases (Dimensions, Scopus etc.) by a team of scientists from Bandung Institute of Technology in Indonesia (Irawan et al., 2020). A complementary analysis also taking into account the rate of evolution of content on the Web of Science and Scopus is also available (Torres-Salinas, 2020). A monitoring of the evolution of research production and types of cooperation (domestic, international, multilateral) based on data from the Dimensions database from January to the end of April 2020 (Hook & Porter, 2020).
- The covid-nma database fed by the Cochrane Institute, INSERM and APHP, which currently includes 809 clinical trials. It is the subject of a regularly updated analysis including mapping (Vuillemot et al., 2020).
- The list provided by the World Health Organization of current vaccine development programmes (Covid-19 candidate vaccines, 2020). This list has just been the subject of an analysis published in Nature reviews (Thanh Le et al., 2020). This work indicates that the majority of initiatives are currently being driven by private North American industries.
- The platform for data mining of scientific publications, research projects and patents on Coronaviruses and Covid-19 by the European Commission in cooperation with TIM Analytics (Knowledge for Policy, 2020).
- The Bibliovid scientific monitoring initiative set up by a collective from the Grenoble Hospital Center with the help of a lung specialist from the Marseille Hospital Center. This platform allows to browse the scientific literature on Covid classified according to 5 main types: prognostic, epidemiological, therapeutic, diagnostic and recommendations.
- Easy access to metadata from Crossref (Kemp, 2020).
- The leak on Reddit of nearly 5,000 documents made available by a hacker wishing to facilitate access to scientific literature that is usually paid for, to researchers in all countries, including sub-Saharan African countries (Freethink, 2020).
- A mapping of research on infectious diseases using data from the Scopus database carried out by the Elsevier publishing team (Elsevier Community, 25 Mars 2020)
- The application of Scite.AI technology to COVID-19 publications to identify citations with positive and negative connotations (Kahmsi, 2020)
- The COVID-19 Graph – Knowledge Dashboard: a dataset of open-access publications on Coronaviruses including information on 189,697 documents and the 49,719 articles cited or citing from this corpus (Peroni, 2020) . The easy access to metadata from Crossref is to be linked to this initiative (Kemp, 2020).
- Since April the 14th, the COVID-19 Graph – Knowledge Dashboard developed jointly by the AMiner team of Tsinghua University, the Chinese Engineering Science and Technology Knowledge Center, the Changgeng Hospital in Beijing affiliated to Tsinghua University, the Alibaba Computer Laboratory, the research center of the Zhiyuan Artificial Intelligence Research Institute in Beijing, Sogou Search and Jiepu. It provides statistics and predictive models of the global epidemic, in order to quantitatively assess and forecast the development and risk status of the epidemic worldwide. It traces the latest developments in all aspects of the epidemic, including scientific research, government dynamics and social opinion.
Finally, while this contribution has focused solely on biomedical research by restricting the query to the Web of Science’s Science and Technology databases and excluding the Human and Social Sciences indexes, this does not mean that coronavirus research is limited to the fields of medicine and biology. Indeed, the epidemic affects all parts of our society, both from the point of view of the response of public services and epidemiology and from the economic, social and environmental aspects. The contribution of the Human and Social Sciences is particularly important in this context, as evidenced by the number of specialists who have been summoned to the media in recent weeks to address the lockdown issue. Specific research coordination initiatives are currently initiated to facilitate exchanges between biomedical research and research in the human and social sciences, particularly in the field of epidemiology. In France, one can think of the actions of the CARE committee, as well as research pooling initiatives such as CovidFight.
More information
This note and the results presented were obtained using the NETSCITY application. This web application applies the methodology developed as part of a research program on the geography of science that began in 2010. It allows the rapid processing of large volumes of bibliographic data, the geographic location of publications, the aggregation of data at the level of comparable urban areas, and the building of networks of places between cities and between countries on a global scale.
This web application, still under development (feedback is welcome), is available online at https://www.irit.fr/netscity.
The development team includes Laurent Jégou, geographer and geomatician at the UMR LISST in Toulouse, Guillaume Cabanac, computer scientist and scientometrist at the UMR IRIT in Toulouse and myself, geographer at the UMR Géographie-cités in Paris – Aubervilliers.
Two students from the IUT of computer science in Toulouse also contributed to the web development: Nikita Yakimovich and Nils Bourgon.
A scientific conference paper presented at the International Conference on Science and Technology Indicators in Rome in 2019 allows to situate the application in the context of science data processing applications and to explain how to use the web application. To refer to it:
Laurent Jégou and Guillaume Cabanac contributed to this note.